Text Posts
One thing I ran across when building my website with Jekyll, a static website generator, was that it restricted my ability to have dynamic content, such an HTML form and blog comments.
Disqus, a popular service that manages comments, alleviated the latter pain, however, the inability to have a simple contact form was huge. There are a couple third-party services that allow you to build forms, but many of them (such as Google Forms) are unnecessarily complex. They often embedded in iFrames or take you to their own domain to submit the form, meaning that they present visitors with a form that doesn't match the rest of the website stylistically, or are taken away from your website altogether.
To fix this, I built Formingo. Formingo is a new service that allows you to easily create HTML forms that get sent directly to your email address. It's completely free to use for up to 500 submissions a month, and there are a ton of new features coming. In fact, just today, I launched pre-verified email addresses and domains.
Create Your Formingo HTML Form in Seconds
You can literally start using Formingo in seconds. If you have an existing HTML form, simply point it to POST at the Formingo service URL and change the example email address to your own.
<form method="POST"
      action="https://www.formingo.co/submit/[email protected]">
   <input name="name" type="text" />
   ...
</form>
That's it. Once you change the action URL for your form, it'll immediately start working. You'll get all the fields in the form submitted directly to your email address.
I have several new features coming soon, including:
- Anti-spam
- Connect your forms to Google Sheets, IFTTT, and more
- View and export form responses and CSV, JSON, and XML
- View form response analytics
Let me know what you think about Formingo, and be sure to get in contact with me if you have a feature you'd like to see.
I pre-ordered the Oculus Rift, a virtual reality headset, on January 6th of this year. After following the Rift from its Kickstarter campaign to trying it in person at PAX 2014, I've been waiting for the promise of virtual reality for years. Last week, my dream finally came true-- I received one of the very first Oculus Rift "CV1" headsets. After plugging it in and launching demos that cannot be explained with words, I noticed something wrong with my PC. The CPU fan was going crazy, and the sensors were reporting abnormally high temperatures.
TLDR: EVE: Valkyrie-- a game for the Oculus Rift-- has a problem where it, occasionally, may change your power management settings at the wrong time, resulting in your processor not throttling down and potentially causing a lot of heat and noise. This was exaggerated by my old, power hungry processor, but might still affect others. You can just right to the fix if you're not interested in my thought process to diagnose the issue.
My computer is relatively old-- in fact, it's based on an OEM HP PC. My motherboard is some obscure brand I can only assume sells exclusively to HP, and my processor is a nearly-6-year-old Intel 970. Though it has 6 true cores, it often can show its age when I try to run modern software. The PC originally came with an NVIDIA GTX 580-- a top of the line GPU of its time-- but I've swapped it out with a newer NVIDIA GTX 970. The old OEM HP case was also beginning to fall apart, with the metal warped and screws rattling inside, presumably from one of the many times I've opened the computer up. I've since switched to a Fractal Design r5, which completely hides that this computer is still based on an OEM model from 2010.
Both Oculus and HTC/Valve have a recommended specification for virtual reality headset users. On the GPU front, I match the recommended specification with my NVIDIA GTX 970. But due to the "Constellation" head tracking system that Oculus uses, they have a recommended CPU model that is many years newer, more powerful, and more efficient than my aging Intel 970. This initially concerned me, but I decided to defer the potentially messy motherboard-CPU-RAM upgrade until some later time. My confidence increased once Valve released a virtual reality benchmark suite, which put my computer as a whole squarely into the "Good for VR" category. Though Valve themselves indicated that the benchmark suite didn't really represent CPU readiness, the fact that my computer could run the benchmark was still reassuring.
An Ominous Whir
I received my Oculus Rift on Thursday, March 31st, and excitedly set it up for the first time. I had pre-loaded the software onto my computer a couple of days earlier during the "launch day"1, so I was almost ready to go. Though my impressions of the Oculus Rift and the arrival of consumer ready virtual reality is enough for a post in itself, it's safe to say that I was incredibly impressed. The "CV1" was a remarkable improvement on the older development kits, and I was extremely satisfied with my purchase.
Though I was blind to it when I used the headset myself (thanks to the audio, which I admittedly was impressed with), when I demoed the headset to others I noticed a fan inside of my case kicking into high gear. I originally was unconcerned, since I realized my aging processor likely struggled with this new, demanding technology.
After an exciting day of demoing the new technology to my family and having some time to play with it myself2, I shutdown my computer for the day. When I started it back up the next day, however, I noticed something was extremely wrong: without any software running and immediately after my computer booted up, that same fan I noticed earlier was running at full force. After some investigation (read: putting my ear to my computer to find the source of the sound), I figured out that the sound was from my CPU fan running at 100%.
Diagnosing the Problem
The first thing to check was obviously the built in Task Manager. My initial thought was that there was some rogue process running my CPU into the ground, and though Task Manager indicated my CPU was at 100% load, there weren't any processes that were obvious culprits. Chrome had occasional spikes into the 50%-usage territory, but it wasn't anything out of the ordinary.
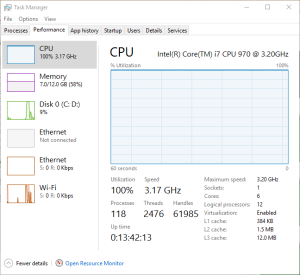 When I switched to the "performance" tab, I noticed something odd. The CPU graph indicated 100% usage, and my processor was running at the full 3.3 GHz without throttling down.
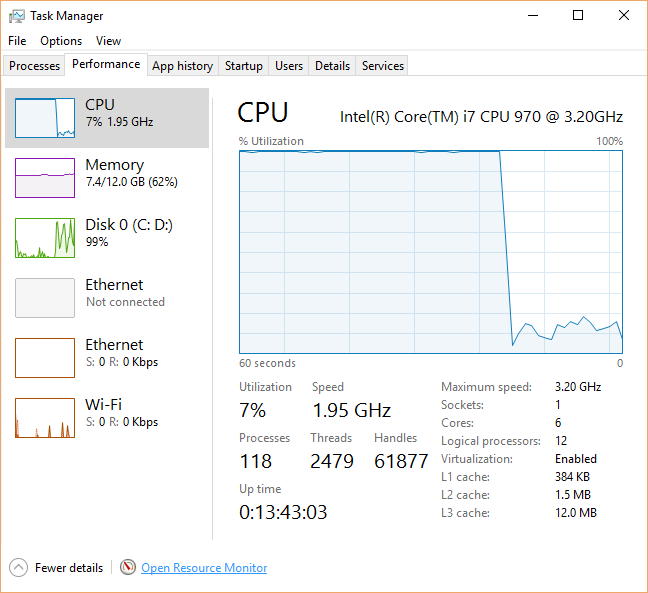
One thing to note with recent Intel processors is their ability to throttle down under low loads. This feature-- called EIST, or SpeedStep-- changes the CPU multiplier to reduce the clock speed, and as a result the power usage and heat generated. This is a good thing under normal circumstances since less heat is generated, and therefore the life of your processor is increased.
 On a normal PC, if you look at the "performance" tab of Task Manager you will see the "Speed" number fluctuate. At high loads it likely will reach at or above your processor's clock speed3, but when sitting in Chrome or checking your email, you will likely see this number drop to a fraction of the normal speed. For example, my Intel 970 runs at 3.2 GHz, though I regularly see it drop to 1.57 GHz.
However, this throttling didn't occur, and the utilization remained at a constant "100%". I looked at the "details" tab of Task Manager-- which shows all processes, including the System Idle Process-- and everything looked normal as well. In fact, if I excluded the Idle process and added up the CPU usage numbers, I arrived at a total of only 2-5% CPU usage. This was nothing like what the other sections of the Task Manager reported.
I also used the excellent "HWMonitor" program to check my temperatures. My CPU ran at approximately 80 degrees Celsius, which was the obvious cause of the fans.
Resource Monitor also reported 100% CPU usage across all 6 cores, though like the "details" tab in Task Manager, there were no processes that used more than 1-2% CPU. I thought that this might be some sort of bug, so I checked a third party task manager called "Process Explorer". It too reported that all processes used less than 1-2% total CPU usage, despite the high temperatures and obvious problem.
As a last resort, I performed a full scan of my computer with both Windows Defender and MalwareBytes, hoping that it wasn't the result of a virus or rootkit. Scans revealed nothing, to my relief.
At this point, I was dumbfounded. Something prevented my CPU from throttling down, yet nothing consumed more than a single percentage point of my CPU with the exception of the System Idle Process, which was normal. I thought back to when the problem started and tried to remember what I installed: nothing. Remember, I installed the Oculus software much earlier in the week. The only significant change was that I plugged in the Rift and tracking camera, but I already had unplugged those to see if their mere presence caused the CPU issue to occur. I was partially in denial-- my new toy was the only thing that had changed, yet I didn't want to accept that it was the culprit. There wasn't really any evidence to suggest this, anyhow.
As a last ditch effort, I booted into Safe Mode. This-- supposedly-- would let me know if it was third party software responsible. As my computer turned back on, I was crossing my fingers. My heart sank as I heard the fans spin back up at full force. I checked the Task Manager once again, and my fears were confirmed-- 100% CPU usage.
Out of ideas and desperate to get back into the virtual realm, I simply reformatted my computer and hoped this was the end of it.
As I reinstalled my software, I had doubts in the back of my mind. I knew that the last major change to my computer was related to the Rift, so I worried that installing the software again would bring the issue back and I would be stuck with the hard choice of letting my CPU run hot, or purchase a new and more efficient motherboard and CPU. Some hours later after the software, my drivers, and everything else I needed was back on my computer, I once again tensed up as I launched a Rift game.
Though the fans spun up while I played Lucky's Tale, shutting down the game and pulling the headset off resulted in the fans once again lowering to a low hum. It wasn't my Rift.
Or, so I thought.
The Problem Returns
The very next day, the problem relapsed. I was heartbroken-- the Oculus software and Rift games were literally the only pieces of software that I had installed, and had to be the culprit. I once again went through the steps: Task Manager, Resource Manager, Process Explorer, and HWMonitor to verify temperatures. Literally all of the same symptoms were reoccurring.
I eventually checked the power management settings built into Windows. I knew that there was a setting for "Maximum Processor State" and "Minimum Processor State", and there was a possibility those were changed somehow. However, they were normal-- 5% minimum, and 100% maximum. However, I was surprised that when I changed the "Maximum" value to 50%, the processor speed also dropped to half in the Task Manager (3.2 GHz to about 1.57 GHz), and the fans spun down. However, the "Utilization" percentage of my CPU was also locked to 50%. I suppose it made sense-- I capped the processor's speed to 50%, so now whatever was using up my entire CPU was just using all of the 50%.
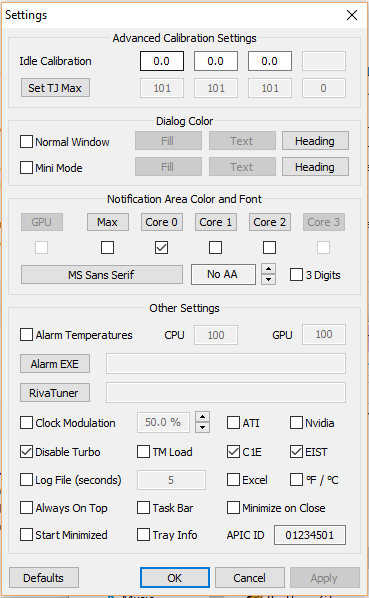
Instead of this being an issue with Windows, maybe it was a problem with Intel's EIST-- that too, could have been disabled. There's a couple programs that support showing the status of Intel EIST, including "RealTemp". However, to my dismay, EIST was enabled as far as I could tell.
Once again, I had to hunt for any leads I could. At this point, I was doubtful that there was any process on my machine that was actually using up 100% of my CPU, so I focused on power management and the throttling issue.
The Discovery and Fix
Eventually, I came upon the documentation for the Windows power management configuration. Though Windows exposes a great deal of power configuration options in the control panel, there are many others that are not exposed in the GUI, and that can be accessed through the command line tool PowerCfg4. There's one setting in particular that was of interest, nicknamed "IDLEDISABLE". The description of IDLEDISABLE was a massive clue:
IDLEDISABLE specifies if the processor idle states are disabled on the system. If disabled, the kernel spins in a loop when there is no code to execute on a processor instead of invoking a transition to an idle state.
With the fans still running at full, I queried the power management configuration of my computer:
PowerCfg /QHSure enough, the IDLEDISABLE setting was set to 0x00000001 for AC power, which is the only setting that matters for a desktop PC:
Power Setting GUID: 5d76a2ca-e8c0-402f-a133-2158492d58ad  (Processor idle disable)
  GUID Alias: IDLEDISABLE
  Possible Setting Index: 000
  Possible Setting Friendly Name: Enable idle
  Possible Setting Index: 001
  Possible Setting Friendly Name: Disable idle
Current AC Power Setting Index: 0x00000001
Current DC Power Setting Index: 0x00000000
Flipping this back to "0" is actually fairly easy. From an administrative command prompt, you need to type two commands:
C:\WINDOWS\system32>PowerCfg /SETACVALUEINDEX SCHEME_CURRENT SUB_PROCESSOR IDLEDISABLE 000
C:\WINDOWS\system32>PowerCfg /SETACTIVE SCHEME_CURRENT
This does two things-- it sets the IDLEDISABLE property on the current, active power management scheme to a value of "0" (i.e. off), and then re-sets the power management configuration so that it loads the new values. Once I performed those two steps, my fans immediately spun back down and the Task Manager reported that everything was back to normal.
Post-Mortem
This simple, two line fix was the culmination of many hours of diagnosis, Google searches, and software updates. But, why did this even occur in the first place?
System Idle Process
First, you will need a little background on the System Idle Process. At a basic level, CPU must always be doing something. However, CPUs run a lot of different processes that are triggered at different times, and often there will be a time where there are no user processes that are running. So, what is your CPU supposed to do? This is where the "System Idle Process" comes in on Windows. The "System Idle Process" is the Windows version of a piece of code that runs when there's nothing else to do5. Essentially, the Idle process is just taking up extra CPU cycles.
This, of course, is why the Idle process is of no concern under normal circumstances. Originally, if you recall, I dismissed the Idle process in the Task Manager's "Details" tab and in Process Explorer. Though it took up 99% of the CPU time, this was normal: the Idle process would yield cycles to other user processes if needed, and it does not normally prevent a CPU from throttling down. In fact, though the Idle process was originally analogous to a while(1){} loop, modern versions of Windows actually run instructions that enable the power saving features of modern processors.
IDLEDISABLE
Of course, the above is true only if the system is allowed to idle. As you may of guessed, the IDLEDISABLE setting actively disables the throttling features of processors, causing the Idle process to revert back to a basic while loop. In Microsoft's words, "the kernel spins in a loop when there is no code to execute on a processor instead of invoking a transition to an idle state".
This, of course, explains why my system never actually felt sluggish, despite the Task Manager reporting 100% CPU usage. Though the Idle process was consuming 100% of my CPU by being in a loop, it yields to user processes, meaning that other programs on my PC could still operate at a normal level.
Oculus Rift and Latency
But, how does this all relate to the Oculus Rift?
The Rift, and virtual reality in general, is very latency sensitive. The device runs at 90 frames per second to reduce motion sickness for the user, meaning that the system only has about 11 ms to actually render a frame. That's a crazy small amount of time for a complete scene in a video game to have its physics calculated by the CPU, rendered by the GPU, and sent to the headset. Dipping below this 90 fps target also is extremely bad for motion sickness, so Oculus implements a ton of different features (such as asynchronous time warp) to help reduce latency as much as possible.
The Rift also implements both rotational and positional tracking, meaning that you can tilt your head in space to have your character in a game do the same, or you can even lean forwards, backwards, or to the side. The Rift has an inertial measurement unit (IMU) package inside of it, with an accelerometer, gyroscope, and magnetometer to determine the movement of the headset. This package runs at a much higher frequency than the similar sensors in your phone-- up to 1000 Hz (one thousand measurements per second), in fact. The Rift also sends these data points every 2 ms over the USB cable.
All of these innovations are needed to reduce latency as much as possible, but there's one thing that they are doing that they haven't talked about to my knowledge-- changing the power plan of your computer to "High Performance". In Windows, there's a couple default "Power Plans". These plans contain the settings-- such as the amount of idle time before your monitor turns off and your computer goes to sleep-- that govern the performance and power usage of your computer. By default, your desktop computer is set to "Balanced", which contains a mix of options that allow your computer to perform well when needed, but still save electricity. There's also a "High Performance" plan that changes characteristics of your computer to help it perform at its maximum at all times.
What you may not notice is when you actually put your headset on6, the Oculus software changes the power plan of your computer to "High Performance". This is immediately toggled back when you take your headset off. The GIF below shows me putting my finger over the sensor-- you can see the Oculus software automatically switching the power plan to "High Performance".
However, the default "High Performance" power plan in Windows actually has IDLEDISABLE set to "0", meaning that the idling features are always enabled out of the box for Windows desktops. On top of that, my issue was that the fans were kicking in because IDLEDISABLE was actually set to "1" on the default "Balanced" power plan.
It turns out, CCP (the developers of EVE: Valkyrie) intentionally set IDLEDISABLE to "1". This isn't exactly far fetched-- Intel actually has a presentation on low latency computing where they suggest that developers do just that to reduce latency as much as possible.
Though they may intend to set the flag to "1" when the game is launched and back to "0" when it is closed, if the game is closed incorrectly (such as if it crashes or is forced to close via the Task Manager, etc.), there is a potential for the IDLEDISABLE flag to remain at "1", thus causing additional heat and fan noise. This can be compounded if EVE: Valkyrie changes the IDLEDISABLE flag to "1" when the power plan is still set to "Balanced", as this is the plan that most computers will switch back to once the Oculus Rift headset is removed.
The Perfect Storm: My Old Hardware
Other than the fact that there's only a couple thousand Oculus Rift devices in the wild, why is it that no one has discovered this before?
My hardware might be an explanation: it's old, more power hungry than newer processors, has a stock CPU fan that definitely needs cleaning, and the thermal paste is probably all dried up by now. It was already running warmer than it should be, but with it running at 3.3 GHz and with IDLEDISABLE set to "1", it heated up enough to cause my loud fan to kick in. With a newer, more power efficient processor or a better CPU cooler, I might not have even noticed the issue. After all, nothing felt sluggish7.
I hope this gives some insight into the process I went through to debug this problem, and save someone time. If you're seeing the Task Manager show 100% CPU usage and your CPU clock at the maximum but without any processes that are obviously the issue, you might want to check the power management configuration of your system to see if IDLEDISABLE is set to "1" when it should be reset back to the default of "0".
This issue has been reported to EVE: Valkyrie and I will update this article as I hear back from them.
- April 4th, 2016 @ 5:40 PM PST - Reported the issue to EVE: Valkyrie support
Special thanks to Reddit user /u/GodLikeVelociraptor, who seems to have pinpointed that it is in fact EVE: Valkyrie causing the issue, not the Oculus software itself. I have updated the article to reflect this fact.
- Considering only a couple hundred to maybe one thousand Oculus Rifts-- and only to the originally Kickstarter backers-- arrived on the launch day, some may hesitate to actually consider it anything but a soft launch. By the end of that week, Oculus CEO Brendan Iribe informed customers that there was a component shortage that resulted in a delay. ↩
- Lucky's Tale, though not a game I would play on a traditional monitor, is actually quite impressive in virtual reality. You can lean in and look at everything like it's a miniature model, and you can even headbutt things in the game world thanks to the positional tracking features of the headset. ↩
- Technologies like Intel's TurboBoost will actually let your processor run above it's "normal" clock speed when it's able to within thermal limits. ↩
-
You must use an administrative command line prompt to change the
PowerCfgsettings. ↩ - A better explanation of this is provided by Gustavo Duarte. ↩
- There is a sensor on the Rift that lets it know when the headset is put on. This allows for the Oculus Home software to launch and the OLED screens to turn on, saving power and the longevity of the screens themselves by not having them be always on. ↩
- Remember, the Idle process was taking up the majority of my CPU in what was essentially a "while" loop. Though it let other software take over CPU resources when needed, it still generates heat if the processor is not allowed to throttle down and idle. ↩
Machine learning is an extremely important topic in computer science. We've come to the point where there's some problems that just cannot be solved with algorithms and code, and machine learning is the solution.
I haven't had a ton of experience with machine learning beyond Andrew Ng's amazing Machine Learning course and I recently set out to change that.
Walt Disney World
Walt Disney World parks attract tens of millions of visitors per year. In fact, Magic Kingdom, the flagship park, hosts about 20 million visitors per year by itself. Given the fixed number of attractions and their ride capacities in the thousands-of-visitors-per-hour, this can translate to extremely long wait times during peak seasons.

In general, you can predict what sorts of wait times to expect based on the day of the week and the season-- September, for example, tends to have fairly low attendance due to kids going back to school, while Thanksgiving is one of the most popular days of the year and often elicits hours-long wait times for some attractions.
Using this information, you can make a general decision on when to make your vacation. Most people don't visit Walt Disney World and stay on a strict schedule-- after all, it's supposed to be a vacation, not a drill.
But, there's a dedicated few that are committed to visiting the maximum number of attractions as possible, and a general sense of park crowded-ness is not enough.
Predicting Wait Times with Neural Networks
With my mission to learn how to use machine learning techniques in a real setting, I decided that predicting theme park wait times would be a good start. The data is available, constantly flowing, and generally in a pattern.
I had a couple of choices-- use some sort of regression model, which was the obvious choice for a job like this (use of continuous inputs to generate a continuous output), or a neural network regression model. Ultimately, for a variety of reasons, I opted to use neural networks.
Many people may believe neural networks are overkill for a simple regression problem, but my experiments with several machine learning libraries determined that it would be the easiest solution to implement and get data from, given that I was using Node.js.
With this starting point, Park Genius was born.
Model Training
Before we can glean any insights from the raw wait time data, we need to train the neural network model. Every couple of minutes, the official posted wait times are sourced from Disney directly. These numbers are artificially inflated, but they give a general sense of how long the wait will be for an attraction. User-submitted wait times are also supported and weighted more heavily to train the model, but with a user base of exactly 11, there wasn't a lot of user-submitted data to use.
Fortunately, the data is both numerous and fairly high quality. There's no real bogus data that needs to be removed, and some of the noise where a wait time will go from 60-to-90-to-60 in the course of a couple minutes is smoothed by the prediction model.
Neural networks are great and finding patterns in data by itself. However, wait time trends actually have more nuanced patterns than simply fluctuating over the course of the day. In fact, there's many "cycles" that affect wait times at theme parks:
- Time of the day. The simple one.
- Day of the year. Holidays are extremely busy compared to a normal day in the same month.
- Day of the week. Weekdays are generally calmer
- Month of the year. During peak seasons, the crowds can be much higher than during the off season.
Additionally, there's special events (such as Disney's Food and Wine Festival at Epcot's World Showcase) that draw a significant number of visitors, but don't necessarily occur on the same set of days every year.
Because of this, a single neural network didn't suffice-- my first experiments resulted in a single neural network producing somewhat reasonable wait time predictions, but could be wildly off between week days and weekends.
The breadth of these "cycles" meant that the minimal set of data I have collected was going to be an issue. Though Park Genius operates on about 65k data points across all of the attractions in Magic Kingdom (as of Feb. 24th, 2016), this is actually not enough. As previously mentioned, there are trends that go beyond the wait time fluctuations in a single day. This means that, at the moment, if you were to look at the predictions for Thanksgiving 2016 or some other holiday, Park Genius would underestimate the wait times. Unless a historical data archive can be used for training, the prediction model will not be accurate for special days, like holidays, until after they've already occurred in 2016.
Prediction Computation
I chose to make a system of neural networks that incorporated data trained using the above factors. This means that each attraction has multiple networks associated with it, which are then consulted at prediction time and combined in a weighted average.
For the current day, the model is both trained and the data re-predicted every hour. This means that as the current day goes on, the predictions for that day will be updated and made more accurate. Watching this process is actually quite fascinating because you can see the prediction lines change over the course of the day as they become more accurate.
Prediction data is available on the site as a simple line graph that shows both the official wait times, as well as the predictions that Park Genius has come up with.
[caption id="attachment_764" align="alignnone" width="932"]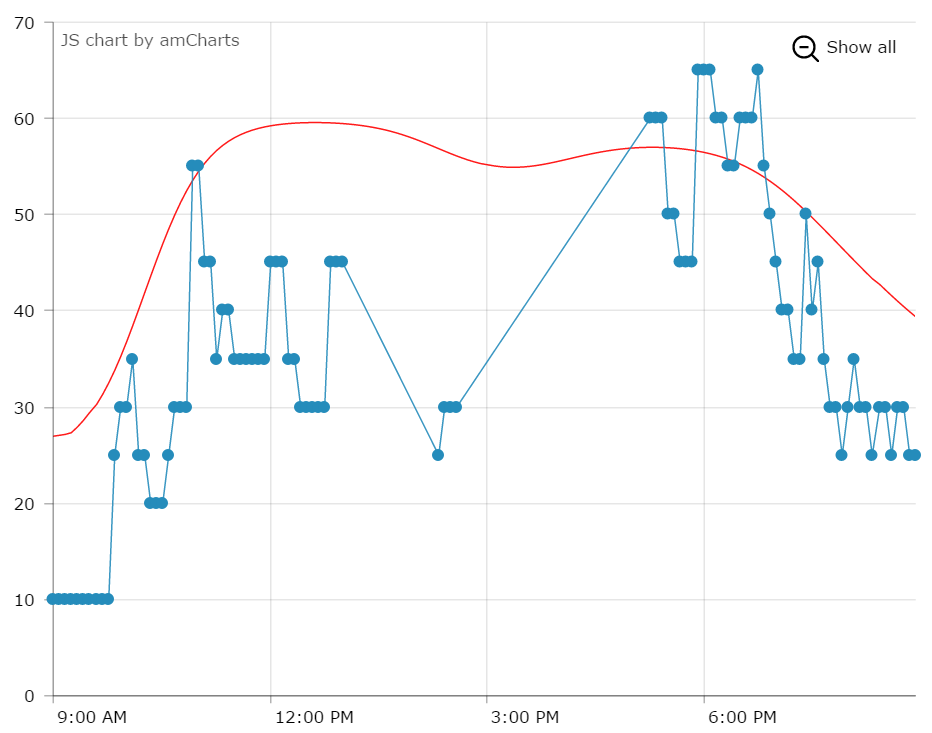 Historical Wait Times and Predictions for Space Mountain, Feb. 23rd 2016[/caption]
Using the Data
Wait time predictions are fascinating, but by themselves not extremely useful. After all, a visitor to Walt Disney World will probably not be able to guess exactly when they will visit which attraction-- especially if it's their first trip.
However, this data can be used in some interesting ways, such as to build a touring plan for the theme parks. Park Genius actually tracks several different attributes of the theme parks and their attractions-- wait times and predictions, the length and intensity of the attraction, and the physical geographical location of the attraction for example.
Using this data together, I can build a touring plan for someone that wants to visit Magic Kingdom, prefers roller coasters, but wishes to skip kid-focused attractions like "Stitch's Great Escape!".
The way to solve for this "optimal", yet customized, touring plan is essentially a dynamically changing travelling salesman problem-- the weights change over the course of the day, but you still want to try and find the quickest route (in terms of travel time and waiting for attractions) between every attraction.
A preliminary version of the planning software actually generated something that is somewhat reasonable looking, and will only get better with some extra tuning.
Though the wait time prediction aspect of Park Genius was fun to implement and a great way for me to use neural networks in a practical application, I'm even more excited to actually use the data in interesting ways. Though the planner is close to completion, I have several new ideas to build on the data set I've collected and can't wait to bring them to fruition.
Be sure to checkout Park Genius and the predictions that it generates. If you're planning on visiting Magic Kingdom anytime soon, it might even be helpful for you.
- That one user, me, doesn't even live anywhere near a Disney park. ↩
The Oculus Rift is finally available for pre-order and many are having sticker shock with the $599 price tag. With tax and shipping costs (really? shipping costs on a $599 device? I suppose I might be spoiled by Amazon), it can come out to almost $700 in the United States. However, this is pretty close to the price of a high-end monitor (such as the curved 34-37 inch models), and you get a decent amount of hardware included: motion tracking, the tracking camera, Xbox controller, Oculus Remote, etc.
For more information on Needlepoint-- my JavaScript dependency injection system--you can take a look at my introductory blog post or the README file on GitHub.
I have updated Needlepoint to version 1.0.5 in NPM. There's a couple changes, none of which should break if you use an older version and upgrade to this version.
Needlepoint is now pre-compiled
This means you don't have to have an entry for the library in your Babel ignore configuration. My first blog post mentions that your Babel configuration should look something like this:
require('babel/register')({
    optional: ['es7.decorators'],
// A lot of NPM modules are precompiled so Babel ignores node_modules/*
// by default, but Needlepoint is NOT pre-compiled so we change the ignore
// rules to ignore everything *except* Needlepoint.
ignore: /node_modules\/(?!needlepoint)/

});
The ignore property is no longer required.
Updated for Babel 6
I also updated the library and instructions to use Babel 6. If you are using Needlepoint with Babel 6, you will have to use the new presets property for your Babel configuration and add the babel-plugin-transform-decorators-legacy plugin. Babel 6 removed the old ES7 decorator functionality and the contributors are re-writing it. However, the legacy plugin enables the decorator functionality now.
To do so, you must install the plugin's NPM package:
$ npm install --save babel-plugin-transform-decorators-legacyThen, once you install the plugin package, you can add it to your Babel configuration:
require('babel/register')({
    presets: ['es2015', 'stage-0', 'stage-1'],
    plugins: ['babel-plugin-transform-decorators-legacy']
});
As you can see in the sample above, I've also included the es2015, stage-0, and stage-1 presets for Babel. You can adjust these as needed for your application.
Though I am an Angular JS type of person, I regularly follow other JavaScript frameworks to keep up with the rest of the world. React, along with the Flux design pattern, is a relatively popular alternative to the Angular ecosystem. However, React+Flux is extremely different from other frameworks-- for starters, React isn't actually a full JavaScript framework by itself, and Flux isn't actually a thing: it's a type of architecture. Tero Parviainen wrote an amazing introduction to the Redux+React ecosystem with an overview of how not only the two libraries themselves work, but conceptually how they fit together and why the Flux architecture and immutability makes sense in a web application.
In the past, I've done a lot of work with PHP and the Laravel framework. One of the coolest features about Laravel is its Inversion of Control system, which dynamically injects dependencies into your application at runtime.
This is beneficial for many reasons, including modularity, readability, and testability. With a dependency injected system, you can simply request that your application receives an instance of an object, and the DI container will do all of the work to initialize the object and all of its dependencies.
Dependency injection is a relatively advanced topic, but the benefits outweigh the cost. For example, consider the following scenario:
class Config {
    public function __construct() {
}

/**
 * Get the configuration item with the specified key
 */
public function get($key) {
    // Get the configuration value with the specified key
    return $value;
}

}
class Database {

/**

* Construct a new database instance using the specified configuration.

*/

public function __construct(Config $config) {

$this->config = $config;

}
public function connect() {
    $host = $this->config->get("db.host");
    $name = $this->config->get("db.name");

    // ... perform the rest of the database initialization
}

}
This is an extremely trivial example, but as you can see, our database object depends on the configuration. If we simply create a single instance of the database, this isn't a problem-- we can simply create a new configuration object and pass it in the constructor. But, what if our application is composed of multiple controllers, utilities, and snippets of code that all need a database instance? Suddenly, we either have to create a large number of database objects (and consequently, a large number of configuration objects), or pass a single instance around somehow.
This is the premise of dependency injection: DI takes the premise of passing instances around, and manages this behavior for you. If we apply our example above to a dependency injected system, we actually don't ever have to explicitly create a configuration object-- our DI system does this for us.
Laravel's IoC system is great-- it's wired up throughout the framework so that most method calls end up having dependencies injected automatically, and it even uses the type hints in the method signature to determine what dependencies the method has.
For example, Laravel's IoC system would use the following method signature to pass in the current HTTP request object and a database instance, automatically:
public function getUsersController(Request $request, Database $db)The DI pattern doesn't just apply to PHP and Laravel-- Javascript frameworks such as Angular and Aurelia have their own dependency injection systems, with the latter even using ES7-style decorators. Unfortunately, these systems are tightly coupled with the frameworks, meaning that they aren't very useful for developers that want to use them with Node.JS.
Needlepoint: Dependency Injection for Modern Javascript
Needlepoint is a new DI framework for Javascript environments that supports the latest ES6 and ES7 features. Everything works with ES6 classes, and the dependency injection parameters are defined using the decorators ES7 proposal.
Need to learn how to use the new ES6 and ES7 features? Check out my in-development course on Modern JavaScript.
Declaring Dependencies of a Class
There's two key decorators that indicate how a class should be dependency injected. First is the @dependencies decorator:
@dependencies(DependencyOne, DependencyTwo)
export default class ClassWithDependencies {
Simple pass in the classes to the decorator, and the dependencies will be injected into the constructor:
constructor(instanceOfDependencyOne, instanceOfDependencyTwo)Declaring a Singleton
The second decorator is used to declare a class a singleton:
@singleton
export default class SingletonClass {
The singleton decorator indicates that no more than one instance of the class should be created in the application. If two classes declare a singleton as a dependency, only a single instance will be created which will be injected into the relevant classes that declared the singleton as a dependency.
The best way to introduce the library is to simply illustrate how it works:
/* config.js */
import {singleton} from 'needlepoint';
@singleton

export default class Config {

constructor() {
}

/**
 * Get a configuration value for the specified key
 */
get(key) {
    return this._data[key];
}

}
/* database.js */
import {dependencies, singleton} from 'needlepoint';
@dependencies(Config)

@singleton

export default class Database {

constructor(config) {

this.config = config;
    this.configureDatabase();
}

configureDatabase() {
    // ... configure the database with the current configuration instance
}

query(q) {
    // ... Perform the specified query
}

}
/* index.js */
import {container} from 'needlepoint';
import Database from './database';
var db = container.resolve(Database);

db.query("SELECT * FROM users");
This example is very similar to the PHP example we previously had-- a database needs a configuration object to configure itself. As you can see, in our index.js file we have a single call to container.resolve(Database) which does all of the magic: the database instance is created and passed in an instance of the configuration, with both being singletons. If we were to call container.resolve(Database) again, we would receive the exact same instance that was created the first time.
The same is true for the configuration object-- only a single instance is created for the entire application, so we might add a new "queue" class that uses the same configuration instance:
import {dependencies, singleton} from 'needlepoint';
@dependencies(Config)

@singleton

export default class Queue {

constructor(config) {

this.config = config;
    this.configureQueue();
}

configureQueue() {
    // ... connect to the queue and configure it with the currently
    // initialized configuration instance.
}

next() {
    // ... get the next item from the queue
}

}
Now, we can run container.resolve(Queue) in our index file and get an instance of the queue class. Of course, since this is the first time that the queue is resolved (either explicitly or as a dependency of another object), it is actually instantiated. However, the constructor is passed in the previously created configuration object-- the same exact instance that was passed to the database.
Of course, this also works with more complex dependency graphs. Image having an application with a dependency graph that looks something like this:
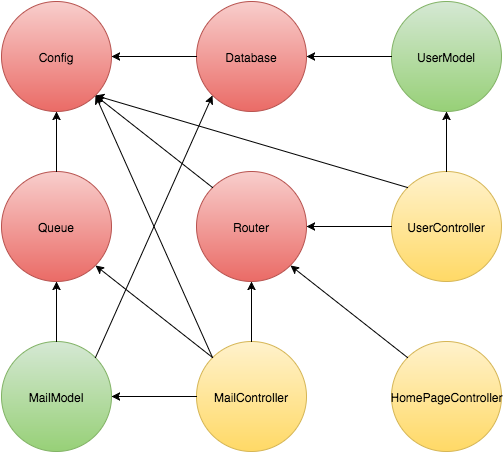
Wiring that up manually and keeping track of everything would be a nightmare (and this isn't even close the complexity of a real application), but with Needlepoint you can simply define each class's dependencies with the decorator.
To find out more about to use Needlepoint and dependency injection in your Javascript applications, you can visit the GitHub repository for the project. The entire thing is open source and written using the latest ES6 features, meaning Babel is required for most Javascript environments.
You can use Needlepoint in your Node.JS applications fairly easily. Simply install it with NPM and ensure you have Babel installed and configured:
npm install --save babel needlepointAnd, in your Javascript:
require('babel/register')({
    optional: ['es7.decorators'],
// A lot of NPM modules are precompiled so Babel ignores node_modules/*
// by default, but Needlepoint is NOT pre-compiled so we change the ignore
// rules to ignore everything *except* Needlepoint.
ignore: /node_modules\/(?!needlepoint)/

});
require('app.js');
/* app.js */
import {container} from 'needlepoint';
// Use Needlepoint here
There's still a ton of things left to do, but you can always help out by submitting a pull request or even just filing an issue.
Docker is fantastic for building a scalable infrastructure. Not only does it force you to isolate your application into reasonable chunks, but it also encourages you to build these pieces as stateless services. This is fantastic for high availability and scalability, but actually scaling out a pure Docker-based infrastructure is difficult if done manually.
Docker Swarm and Compose are the "official" solutions to this problem-- they allow for you to build a giant, elastic Docker cluster that appears as a single machine to your client. Additionally, Compose allows you to scale your application easily to multiple instances.
Despite this, these two components are lacking a couple critical features-- cross-machine service discovery, as well as a built-in load balancer that distributes traffic to your scaled Docker infrastructure.
Tutum is a service that adds these remaining components, and to great success. Though you can use your own nodes with Tutum, sometimes it's desirable to use your own, self-hosted service.
Rancher is an open source Docker PaaS that includes features like service discovery and DNS, load balancing, multi-node support, cross-host networking, health checks, multi-tenancy, and more. Essentially, Rancher takes all the features of Tutum and packs it into a single Docker container that is hosted on your own nodes so that you have complete control.
Even better, Rancher is extremely easy to install in a matter of minutes.
To find out how, check out my new mini-course that I will be expanding over the next several weeks to cover new features in Rancher, as well as expand it to cover how to use advanced features such as service discovery. It's completely free, and I hope you find it useful!
I just launched a brand new, responsive, and completely free Wordpress theme. Inspired by my home-- the Pacific Northwest (of the United States)-- Northwestern is a minimalistic Wordpress theme for independent bloggers.
The theme's look can also be customized to fit your personality, with the primary colors and hero image changeable. Northwestern also supports several of the Wordpress post formats, including "aside", links, and quotes.
Go ahead and grab it for free from my website, and feel free to use it for both personal and commercial websites. More information on the license can be found on the store page.
I've been experimenting with Docker for a while, but in the last year or so there has been an influx in the number of tools that help put Docker containers into production easily. Some of these are from third party companies, such as CoreOS, and some from Docker itself (such as the new Docker Swarm, Docker Machine, and Docker Compose. However, I've recently been testing a new Docker workflow that allows me to push code, have it tested, built, and deployed into a production server cluster running Docker.
My welcome bar service, ThreeBar1, is currently deployed using a continuous integration/continuous deployment (CI/CD) system onto Heroku. In general, new code is deployed with the following workflow:
- Create new feature locally
- Push code to a git repository on a feature/development branch
- Shippable, a CI service, detects this new commit, pulls the code, and runs tests
- If the tests pass and the code is ready to be deployed to production, the a merge request is created and merged
- Shippable detects the new commit on the master branch, runs tests, and pushes the code to the Heroku git repository
- Heroku builds the application slug and deploys the application
This is really convenient for shipping features quickly and ensures that all code on the production servers is tested and working.
However, this becomes an issue at scale-- Heroku is expensive. Though you receive a month's worth of Heroku Dyno hours2 for free each month, scaling beyond a single Dyno is a minimum of $35/month for half a gigabyte of RAM. To be fair, Heroku adds quite a bit of value beyond simply providing a virtual machine, but some applications might require more flexibility than Heroku's buildpacks provide or simply require more horsepower.
Docker, of course, can replace Heroku for the actual deployment of code, but the problem of scaling still remains. Manually starting and restarting the containers when you deploy new code is certainly not ideal, so let's take a look at different services we can use in our Docker CI/CD workflow.
Finding the Pieces
Docker doesn't have an end-to-end solution for this workflow, so we need to piece together several different technologies to get the desired result. The three primary services include: a CI/CD test runner, a server provider, and a container orchestrator.
CI/CD Server, Test Runner
When choosing a CI/CD service, you must ensure they support building Docker containers. Some services that support this include:
There are others as well (including a plugin for the well known Jenkins CI server), though you will have to do your own research. Many services run builds in a container, but this is completely separate from whether they can build a container. As you will see later, you can also run Docker-in-Docker, so you may potentially be able to use some other services that run inside of a Docker container to build your Docker container.
For my experiments, I chose the open source GitLab CI system to be used in tandem with the GitLab source control service. This way, I could see the build status of each commit in the GitLab interface. GitLab is also a good choice because they not only offer a free source code repository hosting service and hosted version of their CI software, but the software is open source so you can run it on your own servers as well.
If you do opt to use the free GitLab CI system, you will have to provide your own test runner. The hosted CI software they run only coordinates test runners-- it doesn't actually execute your test jobs. You can either launch the runners on a server provider, or you can actually run them locally on your machine (either bare metal, in a VM, or in a Docker container).
Server Hosting Provider
Of course, you also need a server hosting provider for the Docker daemon to reside on. Unfortunately, using Docker often entails running and managing your own servers. This means that you are responsible for uptime and maintenance. But, as I will show, you can run a multi-availability zone or multi-datacenter infrastructure with Docker, meaning that downtime for a single machine may not be as critical as you might think.
Common hosting provider choices include3:
- Amazon Web Services EC2
- Digital Ocean (get a free $10 credit with this link, enough for 2 months of server time)
- Vultr
- RunAbove
Orchestration
Even if you have a set of Docker containers built and a server running the Docker daemon, you still need to easily be able to launch the containers and redeploy them when a new container image is built. The orchestration service I've recently been using is called Tutum.
Right now, Tutum is a service that helps you manage your container deployment workflow. At the moment, you can add nodes dynamically from any cloud hosting provider, create new services, and deploy them from a private registry.
Additionally, Tutum creates a private network overlay for your containers, meaning that your Docker services have their own private IP addresses that magically route traffic between every other container in your Tutum account, whether the physical machines are in the same datacenter or across the world on a different provider. This allows you to create a multi-server, multi-cloud solution that is extremely resilient to failure. If you've ever seen Flannel by CoreOS before, the Tutum private network is similar.
I've been looking for this type of service for a while now. A while ago, I experimented with the tinc VPN to create a P2P mesh network between multiple Docker containers. This was long before Docker offered the level of network configuration that they do now, so it's refreshing to see Tutum do the overlay networking so that it just works.
Tutum also aims to eventually integrate native CI/CD features, as well as git-push support. When Tutum is finished with these features, it could potentially become the only other service you need besides a source code repository.
Tutum has a few key features we need for the CI/CD Docker workflow:
- A private Docker registry for container images
- Redeploy containers when a new image is pushed to the registry
- Easy container scaling (in the UI, you can scale a service from
NtoMcontainers with a single slider) - Add nodes as you need, then scale the containers in the Tutum UI
Other nice-to-have features include:
- DNS based automatic service discovery-- after scaling a web app container, for example, your haproxy router will automatically know about the new containers and route to them
- Private network overlay
- Bring-your-own-node-- you're not locked into a single, or specific, cloud vendor
You may be able to find another service that offers similar features (CoreOS + Fleet or Docker Swarm are potential candidates), but Tutum is a complete solution that's ready today.
Assembling Everything Together
I've chosen the following stack for my own personal experiments:
- Hosted GitLab for source code repository hosting
- Hosted GitLab CI for CI/CD
- RunAbove as a server provider for both CI/CD runners as well as container hosting4
- Tutum for orchestration and service management
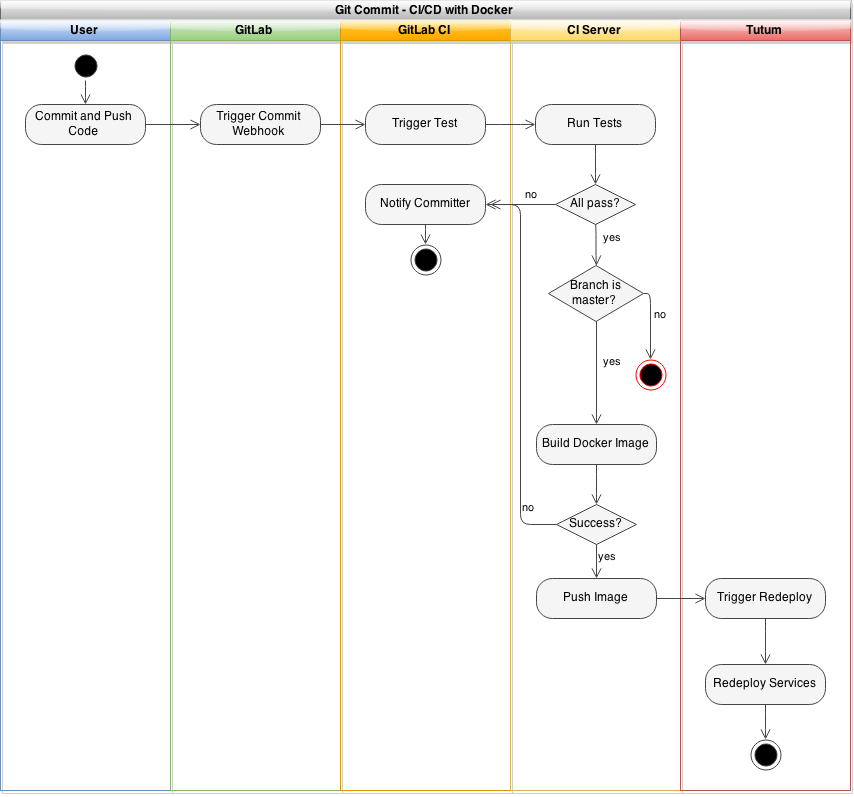
When everything is finished and assembled, a git commit should look like the following:
Deploying the Tutum Agent
Because you can actually use Tutum to deploy the GitLab CI runners, it's a good idea to setup the Tutum agents first. Launch all of the servers you wish to use, and then navigate to the Tutum dashboard where you'll find a "Bring your own node" button. Click this, and you'll receive a command similar to the following:
curl -Ls https://get.tutum.co/ | sudo -H sh -s XXXXXXXXXXXXXXXXXXX
Simply run this code on a node to add it to your Tutum account, and the process for each additional node you wish to add (each time, clicking the "Bring your own node" button to get a new token).
Once the agent has been installed on all of your nodes, you should see them in the dashboard. At this point, you might want to tag your nodes appropriately. This allows you to specify which nodes your services will run on. For example, you might have a set of nodes tagged as staging or production to specify an environment, or a node tagged as ci which only hosts your CI runners.
You can tag a node by clicking it's name and adding the tags in the left hand sidebar.
Deploying a GitLab CI Runner
Now, you can deploy a GitLab CI runner with Tutum. However, we're going to need a special type of CI runner-- we need to be able to run Docker within this container so that we can build our own Docker images.
You may be thinking, how is this possible? Since we will be running the GitLab CI runner with Tutum, it will be within a Docker container itself. So, how do you run Docker inside of a Docker container?
It turns out this is entirely possible to do. In fact, you can even run Docker-in-Docker-in-Docker or nest Docker as many levels deep as you wish. Our final architecture for the GitLab CI runner will look something like this:
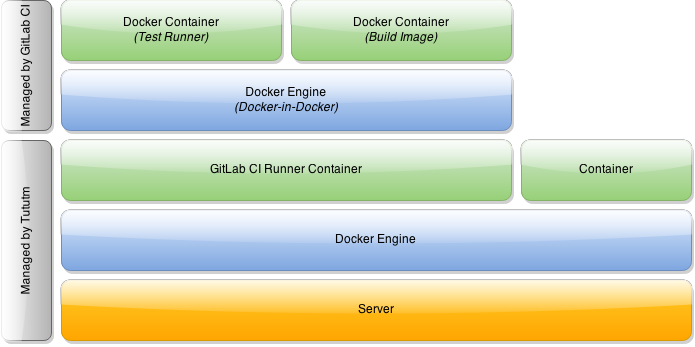
As you can see, Tutum launches the GitLab CI runner within a Docker container on our node. Additionally, the GitLab CI runner will actually use Docker to build images and run tests, meaning we have two nested levels.
I've built in DinD functionality into a forked version of the GitLab CI Runner, available on GitHub and the official Docker Registry.
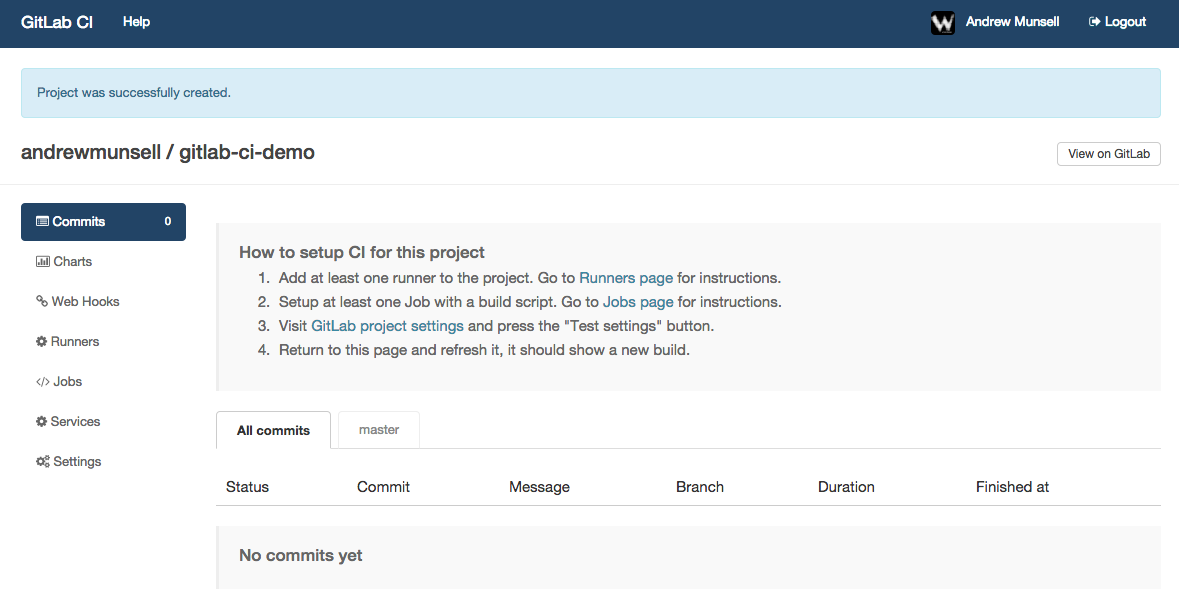
Before you setup your GitLab CI runner, ensure that you already have a repository in a GitLab instance as well as a running GitLab CI coordinator. As mentioned previously, you can either host your own instances, or you can use GitLab's free hosted repository and CI service.
Once you have a repository in GitLab, you can link your GitLab CI account with a couple clicks. After you've linked your accounts together, you'll see a list of your repositories in the GitLab CI dashboard with "Add project to CI" buttons next to them. Simply click the button next to your project to add it to GitLab CI, and you'll see your new project CI dashboard.
If you poke around the GitLab CI interface, you'll notice a menu item titled "Runners". On this page is a registration token, as well instructions to start a new runner. In our case, we'll be using Tutum to deploy our runner with the DinD GitLab CI Runner image. Make sure you copy both the registration token, as well as the GitLab CI URL-- you'll need them both in a couple minutes.
In your Tutum interface, create a new service. A service in Tutum is a logical group of Docker containers all running the same software and using the same configuration. Each service can have zero or more containers running at one time, and Tutum will orchestrate scaling and scheduling your containers across all of your nodes.
On the first screen of the launch wizard, you'll see a few tabs that let you select where your Docker image comes from. Tutum has a built-in, complementary private registry, as well as support for "featured" images and searching through other public registries, including the Docker Hub. Switch to the "Public Images" tab and search for the "wizardapps/dind-gitlab-ci-runner" image, which is the aforementioned DinD modification I have performed on the official GitLab CI Runner repository.
Once you've selected the correct image, you'll be faced with a couple new options regarding scheduling your service containers and basic configuration. For the deployment strategies, it is best to read Tutum's documentation on their behavior, though the default "Emptiest Node" will likely work for the purposes of the CI runner. You also will likely want to leave the number of containers at 1 unless you wish to do parallel builds. If you previously set tags on your Tutum nodes, ensure you enter the correct tags into the "Deploy Tags" field. Essentially, Tutum will try and find a node that satisfies all of the requested "Deploy Tags"-- they are ANDed together.
There is one important setting you must change on this first configuration screen, and it's buried in the "Advanced Options" section-- "Privileged Mode". Docker-in-Docker requires this setting to be enabled, and Tutum fortunately makes it easy to do so.
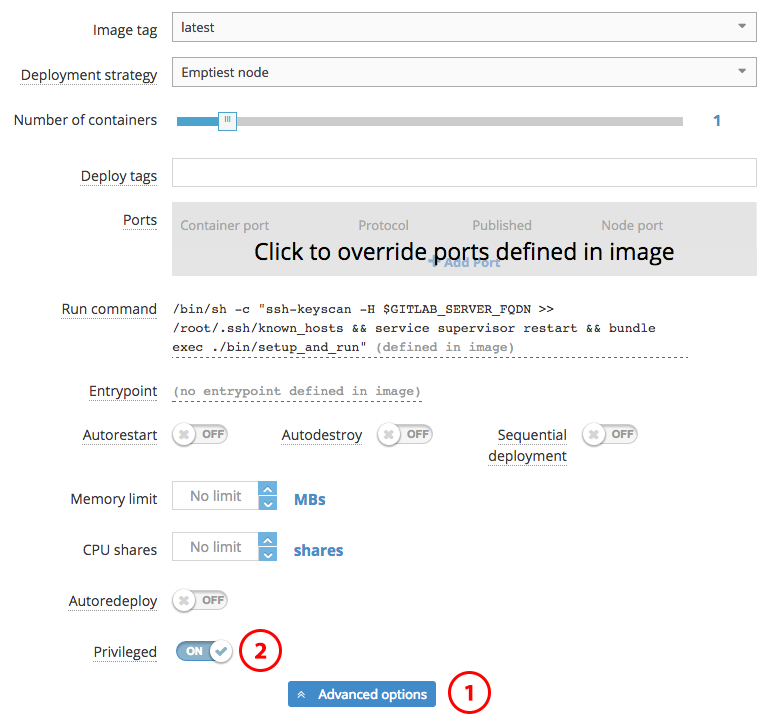
After configuring privileged mode, you can continue to the next screen-- environmental variable configuration.
Like with the Docker CLI, Tutum allows you to specify environmental variables to be inserted into your Docker containers. However, with Tutum, every deployed container will have the same environmental variables. Though we will not use the links feature for the GitLab CI runner, using Tutum's dynamic links, containers will have access to other containers' environmental variables as well.
There's three important variables that need to be configured:
REGISTRATION_TOKEN: The registration token that you copied earlier from the GitLab CI "Runners" pageCI_SERVER_URL: The CI server URL that was provided on the GitLab CI "Runners" page. If you're using the hosted version of GitLab CI, this is "https://ci.gitlab.com/"GITLAB_SERVER_FQDN: The fully qualified domain name for your GitLab CI instance. This is used to perform assh-keyscan. If you are using the hosted version of GitLab CI, this is "ci.gitlab.com"
After you've configured these variables, it's time to "Create and Deploy" your service.
Once the container finishes launching, you can go back to GitLab CI's "Runners" page and you should see a new entry. You're now ready to setup the GitLab CI job.
Creating a DinD GitLab CI Job
The final step to setup our CI/CD workflow is to add the actual job script to GitLab CI. Now, this will vary depending on your project, but one aspect will remain consistent: you'll end up using Docker to build a Docker container, which is then uploaded to your image repository. In this case, it would be Tutum's private Docker image repository.
GitLab CI jobs can be modified in the "Jobs" tab. Within this section, there are two different subsections-- "Test", and "Deploy". As their names might suggest, the test scripts are generally used to run unit or integration tests. The deploy scripts are only run for specific branches once the tests have completed successfully. This allows you to have a test script that runs for every commit, and a deploy script that runs only for the master branch and once all of the tests have completed successfully.
An example test script might look like the following:
docker login -u [USERNAME] -e [EMAIL] -p="[PASSWORD]" tutum.co
Build the Docker image and tag it for Tutum
docker build -t wizardapps/app .

docker tag -f wizardapps/app tutum.co/wizardapps/app:latest
The above test script doesn't actually run any tests, but it does build a Docker image for our application and tag it properly. If you use this as a starting point for your own test scripts, ensure you change the username, email, and password placeholders for the Tutum registry. Because Tutum provides a private Docker registry, you need to ensure your test runner is authenticated with your credentials.5
Then, we could also have a deploy script that actually pushes the image to Tutum's registry, therefore kicking off the build:
docker push tutum.co/wizardapps/app
Auto-Redeploy
At this point, your system should be up and running for builds, and new code should be built as a container and uploaded to the Tutum registry. All that's left is to create your service on Tutum, and ensure auto-redeploy is enabled.
This is done similarly to how we setup our CI services, though instead of making the service "privileged", we want to enable the "Auto Redeploy" switch. Configure all of your service's ports, environmental variables, links, and volumes, and then just hit deploy.
Congratulations, you now have your own Docker application that is automatically redeployed onto a fleet of servers, but only after the code has been tested!
Other Resources
GitLab CI Multi-Runner: https://github.com/ayufan/gitlab-ci-multi-runner
The setup we have requires one CI "service" on Tutum per project-- this can quickly get out of hand. As an alternative, you can experiment with the GitLab CI Multi-Runner, which takes a configuration file and allows for multiple projects to be built.
- I've got some really cool new stuff coming in ThreeBar-- far beyond just a welcome bar. Feel free to sign up to be notified when it's ready! Once it's live, you can see the power of a CI-deployed-Docker-application yourself. ↩
- Heroku runs on a pricing model where you pay by the hour for resources you use. Each "virtual machine" running your code is called a "Dyno", and can run a single command such as a web server or queue worker. You get ~750 hours of "Dyno" usage each month for free, which means you can run one web server per application on Heroku for free if you wish. ↩
- I have personally used all the following server providers, and I do earn affiliate revenue for some of the links in this blog post. However, any server provider that allows you to run Linux instances should work for setting up your Docker server. ↩
- RunAbove's Sandbox platform is great for these experiments because the servers have a high amount of RAM, SSD storage, and are extremely cheap-- around ~$3 USD per month for a server with 2 GB of RAM. However, they are not covered by an SLA at the moment, so for production traffic you may wish to choose another provider. ↩
- At the moment, you must put your Tutum username and password directly into the job script. Unfortunately Tutum does not provide separate passwords or API keys for the registry, so this solution leaves a potential security hole. ↩
Today, LoopPay announced that they were acquired by Samsung. This wasn't entirely unforeseen, considering rumors have been popping up regarding LoopPay's future integration with Samsung phones. The LoopPay system is a new technology that is tied to the current magnetic stripe credit card system. Using a small loop of wires in a special hardware device, the LoopPay devices essentially mimic the magnetic field caused by a swipe of a credit card, enabling mobile payments at nearly every existing credit card swipe terminal.
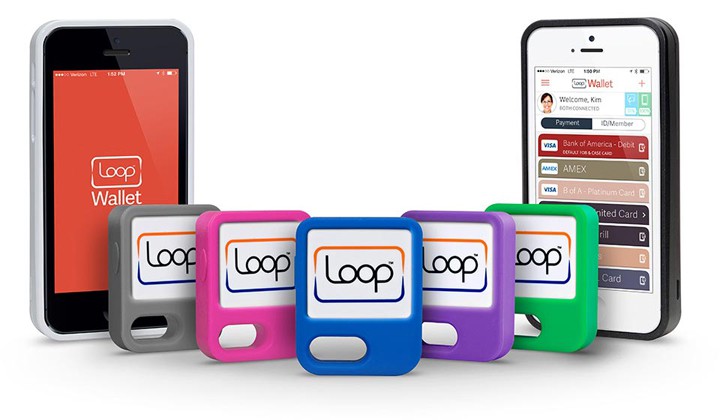
The device works like magic-- simply place the Fob or Card next to the magnetic swipe slot on an existing credit card machine, press a button on your LoopPay, and the reader will act as if a physical card was swiped. I've owned one of these devices for a little over a month (specifically, the LoopPay Card) and it has worked flawlessly every time I've used it on a traditional terminal, but there's one big problem that needs to be solved before LoopPay can become a major player in the mobile payments space.
Traditionally, mobile payments require a special NFC terminal and a phone that supports Google Wallet, Apple Pay, or some other alternative platform. With systems such as Apple Pay, which is built into every iPhone 6/6+, NFC payments are only accepted at around 200,000 kiosks. LoopPay doesn't have this issue-- it current supports an estimated 10 million stores because it uses the existing magnetic stripe infrastructure.
Of course, with the iPhone as popular as it is, a significant number of people now know about mobile payments, and you'll find people paying with their phone more often now than they were a year ago. However, due to Apple Pay's dominance in the market, this also leads to some psychological problems when trying to use a new technology such as LoopPay:
Several times I have been told "we don't support that", when offering up my LoopPay Card. The cashier is confused, and despite trying to explain that it will work with their card reader and offering to show them how, I've never gotten them to budge. They have this preconceived notion that their traditional card terminal will only work with actual plastic credit cards, and the public conflicts between retailers and Apple only solidify the idea that a special terminal is needed for anything else. Needless to say, I've never tried handing a server my LoopPay-- without me physically there to guide them, they certainly would be even more perplexed.

In my experience it could be the actual wording I use, but LoopPay actually has a section in their FAQ dedicated to how to sweet talk a cashier into accepting your LoopPay device. The lack of education around this technology is clearly a problem, and there's no easy solution.
LoopPay's acquisition may actually make the situation worse for a while-- if a new crop of phones appears that can make mobile payments at any terminal, this may actually confuse cashiers more. The average cashier may be able to distinguish an iPhone from other devices and know whether they have a terminal that supports Apple Pay, but I certainly don't see them being able to differentiate the new Galaxy S6 (or, whatever future devices come out with LoopPay integrated) and knowing what to do with it.
If LoopPay is simply integrated with the latest round of Samsung phones and people just use it to pay at self-service credit card terminals (that is, where you don't have to hand your card over to another person), it could bring mobile payments to even more retailers without any effort on their part. Personally, I've already replaced my physical credit cards with my LoopPay card for daily purchases.
But, even if you still have to use a physical card at restaurants or when handing it over to another person, LoopPay's integration into Samsung could help smooth the path for mobile payments. Additional features, like one time card tokens (which LoopPay has previously said is in progress for 2015), may also help LoopPay not only become a replacement for your credit card, but a layer of security as well.
Right now, LoopPay is largely a technology toy and something for me to fiddle with, but maybe their new life with Samsung can help them expand to more consumers and accelerate the death of traditional credit card payments.
NOOBS is a system designed by the Raspberry Pi foundation for installing operating systems onto your Raspberry Pi's SD card. Not only are you able to install an operating system with a single click, but you can install it over a network or even install multiple operating systems on multiple partitions.
For example, if you ever wished you could install both Raspbian and OpenELEC, NOOBS not only makes this possible, but easy to switch back and forth between the two.

Requirements
NOOBS requires a couple of things, most of which you probably already have:
- A Raspberry Pi (any model from the original to the newest Raspberry Pi 2)
- An SD card (or a Micro SD for the newer models) that is 4 GB or larger
- A computer with an SD card slot
One thing you must take note of is the 4 GB SD card requirement. If you have a smaller SD card or you simply need a new one, there are several cheap models that you can purchase:
- Full Sized SD Card (for the original Raspberry Pi)
- Sony 16GB SDHC/SDXC Class 10 (~$10)
- SanDisk Ultra 16GB Class 10 SDHC (~$12)
- Micro SD Card (for the Model A+/B+ or newer)
- SanDisk Ultra 16GB UHS-I/Class 10 Micro SDHC (~$8)
- Samsung 16GB EVO Class 10 Micro SDHC with Adapter (~$11)
All of the above micro SD cards come with adapters, so if you want to purchase the micro SD you can use it in your original Raspberry Pi and later move it to a model A+/B+ or newer at a later time.
Preinstalled NOOBS SD Cards
You can also purchase an SD/micro SD card with NOOBS preinstalled. This is more expensive than just loading NOOBS onto an SD card yourself, but is an option for convenience:
Installing NOOBS
First, you must download the NOOBS image from the Raspberry Pi website. There are a couple different options for download:
- NOOBS (offline installer)
- Torrent
- Compressed ZIP
- NOOBS LITE (online installer)
- Torrent
- Compressed ZIP
The offline installer is significantly larger than the "LITE" version, but comes with the ability to reinstall the Raspbian operating system without a network connection. This is because the actual OS image is saved onto the SD card when you install NOOBS for the first time. However, over time the OS image that is included in the NOOBS installation may become outdated unless you have a network connection, in which case the newer OS version will be downloaded and installed.
NOOBS LITE is significantly smaller in size, but requires a network connection to install the OS images. Both the regular NOOBS and NOOBS LITE installers allow for installing from a network.
Once you've downloaded the version of NOOBS you prefer (either the regular version or LITE), then you can simply extract the ZIP file.
Formatting Your SD Card
Before you can actually place NOOBS onto your SD card, you must format it. Note, formatting the card erases all data on it1.
Mac (the easy way)
On the Mac, you can use the built in "Disk Utility" application. Launch "Disk Utility" and insert your SD card into your Mac. You'll see it in the sidebar of the application, along with some items that are indented underneath it (what these items are and the number of them will vary based on how you previously used your SD card).

Ensure you select the root SD card (that is, the top most item), and switch to the "Erase" tab on the right hand pane. Leave the format as "FAT" and choose a name for it, which will be all uppercase letters. Then, simply hit the "Erase..." button in the bottom right to format the card.
Windows or Mac
Because we want to format the entire card and not just a single partition, you may want to use the SD Card Formatter by the SD Association. Once you've downloaded the formatter from their website, insert your SD card and run the formatter tool.
When you open the formatter tool, you'll have a few options-- the SD device to format, the type of format operation, and the new name of the SD card. Make sure you select the right SD card if you have multiple SD cards plugged into your computer. You can choose either format type, though the quick format is usually sufficient if you are not trying to erase sensitive data. Finally, for the name, choose whatever you wish and fit the "format" button.
Copying NOOBS
Once you have a formatted FAT SD card, you can simply copy the files for NOOBS that you extracted earlier. A simple copy and paste is all that is needed. It might take a while to copy the regular version of NOOBS due to the slow speed of SD cards, but once it's done you can eject the card from your computer and insert it into your Raspberry Pi.
Using NOOBS
Installing an OS
Before you plug your Raspberry Pi into the power cable, attach a USB keyboard and mouse so that you can navigate the NOOBS interface. Once you have the keyboard and mouse plugged in, you can turn on the power to your Raspberry Pi and you should be greeted with a screen similar to the following:
This is the operating system installation screen, and allows you to choose one or more OS images to install onto your SD card. Notice the icons on the right hand side-- those OS images with a picture of an SD card are already included with your NOOBS installation, while those with an Ethernet symbol can be downloaded over a network.
Simply check the boxes next to the OS images you wish to install, and hit the install button in the toolbar at the top of the window.
Boot Selection
Once you've installed one or more operating systems with NOOBS, rebooting your Raspberry Pi will result in one of two things happening automatically:
- If you have a single OS installed, it will boot automatically
- If you have more than one OS installed, a boot selector will be displayed

To get back to the OS installation screen, simply hold the "shift" key on your keyboard as you turn on your Raspberry Pi.
Other Resources
If you wish to just install a single operating system, you might find my tutorial on installing the Raspbian OS directly onto your SD card. With this method, the Raspberry Pi will automatically boot into Raspbian, though you do not get any sort of interface for reinstalling the operating system.
Advanced information on the NOOBS system can be found in the GitHub repository. This includes info on silent installation, as well as configuring advanced parameters such as choosing your auto-boot partition or forcing a display mode.
- Technically, if you do not overwrite the data (e.g. use a quick format) then you can recover the data, but I wouldn't count on it... ↩
A couple days ago, the Raspberry Pi foundation released the Raspberry Pi 2. The Raspberry Pi 2 comes with some fantastic new features that I'm looking forward to utilizing, including an upgraded processor and RAM. Even better, the hardware comes in at the same $35 as the original model B.
Where Can You Buy a Raspberry Pi 2?
Unfortunately, the Raspberry Pi 2 sold out pretty quickly from a lot of distributors. However, you can still backorder a Raspberry Pi 2 and you'll receive it as soon as it comes in to your distributor.
- United States
- Newark/Element 14
- Allied Electronics
- Canada
- Newark/Element 14
- UK
- RS
The Things That Haven't Changed
The Raspberry Pi 2 is physically similar to the current model B+, meaning that your existing cases and accessories will likely work on the new device without much (or any) modification. Cases especially will work with your new Raspberry Pi 2 without any modification. The pins are also in the same place, meaning you can continue to use any of your existing projects that connect to those.
Additionally, the micro SD card you use with your current model B+ will physically fit just fine in your new Raspberry Pi 2 (though, you will have to reformat it and reinstall the OS, as noted below). However, remember if you have an original model A/B, you will need to purchase a micro SD card as the original model used a full sized SD card.
The Things That Are Different
One thing to note, if you are upgrading from an original Raspberry Pi (model A, A+, B, or B+)-- the updated processor means that you will not be able to just move your SD card from your old Raspberry Pi to the new one. However, many of the popular operating systems have been updated for the Raspberry Pi 2, including:
- Raspbian
- OpenELEC
- OSMC
- Snappy Ubuntu Core
- Debian Jessie
As usual, these operating systems can be installed manually with their respective OS images (available on the Raspberry Pi website) and using the image flashing method, or with NOOBS.
In the future, you'll also be able to run a version of Windows 10 through the Windows IoT program.
Once my Raspberry Pi 2 arrives, I'll have more information on cool things you can do with the increased power. If you'd like to know when I write a new article, feel free to subscribe to my mailing list.
What better way to start the new year than with a couple quick lessons on new JavaScript features. I'm in the process of writing a series of short lessons on the new ES2015/ES6/ES7 JavaScript features, such as the immensely helpful classes and arrow functions.
For this course, I've also written a series of quizzes that help you keep on your toes-- simply register for an account, navigate to the course page, and click the button titled "Start Taking this Course". You'll be able to take the quizzes and see your results, along with keep tabs on your reading progress. All of this is completely free and you are not added to mailing lists of any kind (the email address is required so that you can reset your password if needed)!
If you wish to receive notifications when I post new JavaScript lessons, you can always sign up for my JavaScript mailing list below. You'll never get any spam and you'll receive notifications when I post new lessons or have a new JavaScript-related tutorial or tools to show you.
Update: As of October 15th, 2015 (about 10 months after I originally wrote these instructions), Plex has finally removed the hard coded maximum bitrate. This guide will remain for historical reasons, but you should now not be required to follow these steps to stream high bitrate video to your Chromecast.
I am an enthusiastic user of Plex, but recently I discovered that they were making the poor choice of hard-coding a bitrate limitation in their Chromecast application. Essentially, this enforced a 12,000 kbps (~12 mbps) limitation on media, meaning that anything that has a higher bitrate would be transcoded. This isn't a problem when you have a decent server running Plex, but I am running it on an old laptop that can barely keep up with 4 mbps transcodes.
I was able to get around the hard coded limitation (the technical how-I-did-it is also available), and you can do it to:
Requirements
Before you begin, you need a couple of different things:
- Chrome web browser
- A Plex server
- A Chromecast
- A Chromecast developer account
- $5.00 USD (payable to Google for your Chromecast developer account)
- Static file hosting, such as GitHub Gists or Amazon S31
Note, this hack only works in Chrome. It does not allow you to start casting high bitrate content from your iOS or Android devices.
Setting Up Your Chromecast
First, we will setup your Chromecast as a developer device. Because Chromecast applications (custom ones like Plex uses, at least) are vetted through a similar model as a mobile phone app store (i.e. they need to be approved before being runnable by others), we can't just point a Chromecast to your new application. Also, I cannot personally host the modified application because of copyright laws (the code is property of Plex), so you must do the modification yourself.
Before you can actually make the modification, though, you need to turn on developer mode on your Chromecast. You will need a Cast Developer Account, which is used to make your devices "developer" friendly. This has a one time fee of $5.00.
To register for a Cast Developer Account, visit the web console and sign in with your Google account:
https://cast.google.com/publish/
You will see something like the following.

Simply follow the registration process and pay the $5.00 registration fee, and you will be taken to the dashboard.

Now, go ahead and click "Add a New Device". Go to your physical Chromecast device and look for the serial number on the plastic housing, and input it into the form. You can also set a friendly description so that you know which Chromecast is which if you are registering more than once device.
You may want to register all of your Chromecast devices at once, since they take about 15 minutes to become ready.
Once you've added all of your devices to the console, you will need to wait about 15 minutes2 for the status to change to "Ready for Testing". Once the device is ready for testing, you will need to reboot your device. The best way to do this is to unplug your Chromecast for a 60 seconds or more, then plug it back in.
Important: If you have a Chromecast (and not another Google Cast device), you will need to ensure your device sends its serial number when checking for updates, before rebooting the device. To do this, you can open the Chromecast app on your phone or tablet, and look in the device's settings. On iOS, you can get here by tapping the Chromecast's name in the list of devices, then "General":

After your Chromecast is set to send its serial number when checking for updates, you can perform the reboot by unplugging the device for 60 seconds and plugging it back in.
Modifying Plex's Chromecast Application
We can now remove the hard coded limitation of 12,000 kbps that Plex has set in their application. To do this, you need to download two files to your desktop:
To save the files, right click anywhere on the page (that is not on the image, if you're looking at the "index.html" file), choose the "View Page Source" option. Browsers other than Chrome may use different wording for this menu item.
This will allow you to copy the raw source of the page without the browser tampering with it. Copy and paste the "source" of each of the above files into files on your desktop with the same names (i.e. "index.html" and "plex.js").
Now, you will need to actually perform the modifications.
plex.js
Open the "plex.js" file in a text editor.
If you are on Windows, I highly suggest that you do not use Notepad. Notepad++ is a great, free alternative text editor. It is designed for programmers (unlike regular Notepad), so it won't mess up the files you are trying to edit. Mac users can use any text editor they wish, except TextEdit. TextEdit mangles the HTML file even worse than Notepad on Windows, and tries to convert it into a rich text document. TextWrangler is a good, free, and lightweight text editor.
You can use the find command in your text editor (usually "Ctrl + F" or "Cmd + F" on a Mac) to look for the following text:
{"maxBitrate":12e3,"maxBitDepth":8,"maxLevel":42}
Simply change that section of code, so the code surrounding it now looks like the following:
{"maxBitDepth":8,"maxLevel":42}
Notice the missing code: "maxBitrate":12e3,. This is the bitrate limitation converted to scientific notation.
Save the file-- we're now going to upload it to GitHub's Gist service.
Go to GitHub's Gist service, and paste the content of your modified "plex.js" file into the text window. Because the file is so large, it will take a couple seconds. Also, in the "Name this file..." textbox, enter "plex.js":

Once you hit the "Create Secret Gist" button, you will see something like the following:

Go ahead and click the "Raw" button in the top right hand corner of the file's contents, and you will be taken to a page with just your Javascript's content. Make a note of the URL, which will look like the following:
https://gist.githubusercontent.com/anonymous/893e8e7d30cc62d78a2e/raw/a9de6d7d48cc201322235de6315a136b2d2beec1/plex.js
Change the domain in the URL to githack.com, like so:
https://gist.githack.com/anonymous/893e8e7d30cc62d78a2e/raw/a9de6d7d48cc201322235de6315a136b2d2beec1/plex.js
GitHack is a service that transforms raw GitHub Gists into files that render in the browser. By default, if you visited your page the browser would just consider the file to be plain text.
Now, we need to modify the page that is actually loaded by the Chromecast.
index.html
Open the "index.html" in a text editor.
You will need to make a couple of modifications to this file.
If you used the "View Page Source" method, find a line with the following:
<link rel="stylesheet" href="css/main-chromecast.css?hash=b4261cc">
Simply add a new line above it with the following content:
<base href="https://plexapp.com/chromecast/qa/"/>
Also, find the line with the following content near the end of the file:
<script id="plex-script" src="js/plex.js?hash=b4261cc&version=2.2.6"></script>
Change this to the URL that you made a note of earlier, with the "githack.com" domain:
<script id="plex-script" src="https://gist.githack.com/anonymous/893e8e7d30cc62d78a2e/raw/a9de6d7d48cc201322235de6315a136b2d2beec1/plex.js"></script>
Now, save the file and copy its contents. Create a new GitHub Gist and paste the contents of the "index.html" file into it. Change the name to "index.html", and then create the secret Gist.
After the Gist is created, click the "Raw" button. Make a note of this URL, and also change the domain to "githack.com" like you did for the other file. Now, if you open this new URL in your web browser, you should see the following:

This means your application is now working correctly, so we can go ahead and publish the URL into the Cast Developer Console!
Side note: You can use other hosting services, such as Amazon S3 or shared hosting, if you have them available. Simply change the above instructions to point to the relevant locations.
Publishing the Application
Go back to the Cast Developer Console, and click "Add New Application". Choose the "Custom Receiver" application type and choose a name for your application. For the URL, use the "githack.com" URL that points to your "index.html" file.
You will see a "successfully registered" message, and be presented with an application ID that looks like: 4580A3F9. Make a note of this.
Installing the Chrome Extension
I developed a Chrome extension that performs the modifications necessary to the Plex website to inject your new app ID into the Plex web application. This allows for you to use your modified Chromecast application instead of the default one.
You can download the extension from my website.
The download will pop up a scary message saying that the extension may be able to harm your browser-- this is only because it has not been uploaded through the Chrome web store. You can check the source of the extension if you are a developer, or just ignore the message and hit "Keep".
Because the extension is not through the web store, you have to install it from the Chrome extensions page. Go to your Chrome settings and click "Extensions" in the sidebar, or navigate to "chrome://extensions" in another tab.
Open your downloads folder in Windows Explorer or your Mac's Finder, and then drag the extension you just downloaded onto the Chrome extensions window. You will be prompted to add the extension.

Now, you can add your application ID to the extension. Simply click the "Options" link next to the "High Bitrate Plex for Chromecast" extension in the list, enter the application ID you made a note of earlier, and hit save. You may wish to restart your browser for good measure.
Fixing the Chromecast Profile
Before you can actually stream higher bitrate media, you also need to change the XML profile for the Chromecast. On your Plex Media Server, find the "Chromecast.xml" profile located in the resources folder of the Plex server.
On Windows, this is found in:
C:Program Files (x86)Plex Media ServerResourcesProfilesChromecast.xml
On the Mac, the profile is located in:
/Applications/Plex Media Server.app/Contents/Resources/Profiles/Chromecast.xml
On Ubuntu, the profile should be located here:
/usr/lib/plexmediaserver/Resources/Profiles/Chromecast.xml
Open the XML profile, and find the following line:
<UpperBound name="video.bitrate" value="12000" isRequired="false"/>
Simply change the 12000 to a larger number, such as 300003, and save the profile. Restart your Plex server to apply the new profile changes.
Wrapping it Up
Now, go ahead and go to the Plex web application. With any luck, you'll see the Chromecast icon pop up as usual. Now, when you try and cast content, you should actually see your application's name in the Chromecast extension instead of just "Plex".
This also means you can now cast high bitrate media (i.e. over 12,000 kbps) to your Chromecast without transcoding! You can verify this with any high bitrate media you have, or with the Jellyfish Bitrate Test videos. If you use the Jellyfish test videos, try out the 20 mbps or 25 mbps files-- files in the 40 mbps did not work for me.
Once this fix is applied, all you have to do is install the Chrome extension onto any computers you wish to cast from. And because the Chromecast streams directly from your Plex server, you don't even have to keep the PC on-- you can put it away after you start the stream.
Hopefully, this proves to Plex that there is demand to remove the single maxBitrate statement in their Chromecast application. It's obvious that the device is capable, and beyond me why they have stood their ground for so long. At least for now this limitation is just a slight inconvenience than a complete showstopper.
- Shared web hosting accounts, basic object storage, and any other publicly accessible web storage will be fine. Even GitHub Gists will work, which I will show you how to use. ↩
- You can always skip ahead to the next step and upload your Chromecast application and come back to the remaining part of this step later. ↩
- The Chromecast begins stuttering around 30,000 kbps. So yes, there is an upper limit, but it's over double what Plex has initially set. ↩
I am a big fan of Plex Media Server-- it has a great set of software, both server and client side, and is much easier to setup and use than alternatives such as XBMC. Attached to my ReadyNAS, my Plex server has access to 6 TB of storage.
I also have several Chromecast devices-- they're great little media streamer sticks that simply plug into your HDMI port on your TV. Using your phone as a remote, you can "cast" media from an app (such as Netflix, HBO, or Plex) and onto your TV. Chromecast also has a browser API, so Plex's website also allows you to cast media to your local TVs.
There's one major issue, however, in terms of compatibility between Plex and the Chromecast-- and it's not actually the Chromecast's fault. Plex, for whatever reason, has decided to limit the maximum bitrate of a video file to 12 mbps when casting to a Chromecast device. If you have a powerful PC running as your Plex server, this is fine-- the server software will transcode the higher bitrate videos on the fly to 12 mbps. But, I am using an old laptop that can barely transcode to 4 mbps, 720p video files, so the video playback stutters.
Plex claims this forced transcoding is due to "performance issues" with media over 12 mbps, but this is not true1. Not only have users casted media higher than 12 mbps from other apps, but I have successfully gotten around this hard coded limitation and streamed 20+ mbps video without a problem.
Note: This is a detailed post on how I figured out my workaround, and contains some technical material on advanced Javascript concepts. If you are an end user that just wants to perform the fix yourself, please see my separate how-to guide:
The Hard-Coded Problem
First, to understand the issue, you have to know how a Chromecast app and Plex work:
Essentially, when you hit play and stream to your Chromecast, Plex does a few things:
First, the media is checked against an XML based profile for your device that is located on your Plex server. This profile contains info about what device supports what features, and if the media is too high resolution or too high bitrate, Plex decides to transcode the video to a compatible format. The Chromecast file specifies a maximum bitrate of 12,000 kbps.
But, what if we change this XML profile to specify a maximum bitrate of 30,000 kbps? This would solve the problem for most devices, but this does not fix the issue for the Chromecast. Some people believe that they are fixing the issue by changing the XML, but this is not true. There is in fact a second place where this 12,000 kbps limitation is enforced, and it is not changeable by conventional means.
Chromecast apps are composed of two things-- a sender application, which can be a native mobile app or a web application for Chrome, and a receiver application that runs on the Chromecast. The Chromecast also has several types of receiver applications, including the default video player (which basically allows you to send a URL to it and it will use a default UI for playback) and a custom receiver. The custom receiver is essentially a web page and can run most code any web browser can, allowing you to style and program the application to do more than just play a simple video.
Plex has opted to use a custom receiver in order to display poster art on your screen, among other things. However, since custom applications can run arbitrary code, they have hard coded a 12,000 kbps limitation for videos, which overrides the XML profile on your server.
Don't believe me? Check for yourself-- the Plex Chromecast app is composed of several files: an HTML page, which serves as the view you see on your screen, and a Javascript file with logic for communicating with Plex2. These files are located at:
- https://plexapp.com/chromecast/qa/index.html
- https://plexapp.com/chromecast/qa/js/plex.js
In the plex.js file, search for the line containing maxBitrate: 12000. If you're a programmer, you can follow the code, but essentially this maximum bitrate overrides any other maximum bitrate sent to the Chromecast (such as the one that is sent to the Chromecast from the XML profile).
Notice the "qa" in the URL-- this is a "testing" version of the app which is not compressed, and therefore is readable to humans. This is also present in the production app, which is compressed.
- https://plexapp.com/chromecast/production/js/plex.js
You have to look for something a little bit different: "maxBitrate":12e3. In case you're curious why this is, it is because the compressor (really, it is called a "minifier") converts the number 12,000 into the shorter "12e3", which is simply exponential notation for the same value. This allows the file to be smaller, and reduce network overhead and the time to download the Javascript application to your Chromecast. Many websites use this technique, and because the Chromecast is web based, Chromecast applications should do this as well.
Removing the Maximum Bitrate through Reverse Engineering
Now that we know where the limitation is and how it is enforced, we can try and remove it. This post is dedicated to detailing how I came up with my solution-- if you are just a Plex user that wants to play back high bitrate content, see my how-to guide.
There were a couple different ideas that popped into mind:
- Man-in-the-middle the Chromecast, and dynamically replace the value
- Modify the Plex server application to ignore the 12,000 kbps limitation from the Chromecast
- Modify the Chromecast application to remove the limitation
Man-in-the-middle
Essentially, a man-in-the-middle (MITM) "attack" is the practice of inserting a computer between a client and server with the intention of reading or modifying the data that is sent over a network. You can use this for malicious purposes, such as stealing unencrypted passwords over insecure WiFi, or for legitimate purposes such as debugging (i.e. looking at the network requests your app sends so that you can find and fix bugs).
This is a relatively complex method of removing a simple number from a file, so I explored some alternatives.
Modifying the Plex binary
Another way to "fix" the issue would be to modify the server software itself. This poses a couple challenges, however-- the debugging process, for me, would take quite a bit of time to find the point at which the code needs to be modifier, it requires re-applying your modifications every time the server software is updated.
Modifying the Chromecast app
Finally, I decided the best chance of fixing the issue would be to modify the Chromecast app itself. This would be similar to the MITM attack in that I would modify the source code of the Chromecast receiver application, but it would be a one-time fix versus doing it on the fly as I would have to do with a MITM.
Chromecast applications are vetted through a process similar to a native app store-- in order to use them on any Chromecast, you must submit the application and have it approved. However, developers can run whatever applications they want, similar to how you can register as an Apple developer and run your own applications without publishing them in the app store.
So, now that we know that we can run custom applications, all it takes is downloading the original Plex assets, re-uploading them, and removing the hard coded limitation.
Even though the application has now been modified and fixed, we still can't use it. On the sender side, Chromecast applications pass an application ID number to the Chromecast API in order to launch the app. The senders for Plex are located in their native apps (iOS and Android), as well as their web app. Because web browsers are much more open, I decided to tackle the web application.
Unfortunately, the application ID value is embedded deep in the application's Javascript. Plex also uses RequireJS, meaning that there is no way to simply override a global configuration variable.
The application ID is passed into the Chromecast API through the chrome.cast.SessionRequest object, like so:
var sessionRequest = new chrome.cast.SessionRequest("ABC1234");
So, we now know the last point at which we can modify the application ID easily-- in the constructor for the session request.
Fortunately, this also gives us a vector through which we can inject a variable. Because the Chromecast API is located in the global namespace, any script can access and modify it.
We can obviously assign anything to the chrome.cast.SessionRequest variable, and since "classes" in Javascript are essentially defined with functions, we can do something like this:
window.chrome.cast.SessionRequest = function(id, c, d) {
    console.log(id);
};
Now, every time a new SessionRequest is created, the ID will simply be logged to the console. Of course, since we completely replaced the Chromecast API we actually just disabled the casting functionality entirely. To fix this, we can essentially try to subclass the SessionRequest to override the constructor. By doing so, our new object will retain all of the functionality of the old SessionRequest, but with the benefit of overriding the constructor to pass in our ID:
window.chrome.cast.SessionRequest = (function($parent) {
    var SessionRequest = function() {
        arguments[0] = "ABC1234";
    $parent.constructor.apply(this, arguments);
};

SessionRequest.prototype = $parent;

return SessionRequest;

})(window.chrome.cast.SessionRequest.prototype);
The above code is relatively simple, though it may be a little foreign to those not familiar with how Javascript works. We are doing a couple things here:
- Wrapping the new object definition in an anonymous function so that we don't leak objects
- Passing the old prototype into the anonymous function as
$parent - Creating a new object that will serve as our injection script
- Setting the prototype of our new injector to be the same as the old SessionRequest, which is similar to "inheriting" all of
$parent's methods - Calling the "parent" constructor in our new constructor, with the arguments modified
The net result of this is a new object that behaves almost exactly like the old SessionRequest, but that injects and overrides the passed in application ID. We also assign this new object in place of the old SessionRequest, which means that all existing Chromecast code will continue to work.
To test this, I simply ran the injection code and started casting Plex to my Chromecast. With the developer "unlocked" Chromecast device, the injection code worked successfully and my device appeared in the popup menu for the Chromecast extension. After I hit "Start Casting", the custom application name appeared3 and what appeared to be the Plex app showed up on my TV.
Of course, to this point, I was injecting this code manually. This involved opening the web console, pasting the injection code, hitting refresh, and then hitting "enter" in the web console the run the code as soon as I saw the page load. This was hit or miss, and relied on me timing the button press correctly. Instead, I decided to make a simple Chrome extension that would inject the code for me.
Building the Chrome Extension
The Chrome extension was quite simple, but because I'd never written one before, I ran into the sandboxing security feature several times.
Though a "content script" extension can modify a page, it cannot access the same set of variables. In other words, I could not simply run the injection code from my content script and expect it to work, since the code would try and modify a property of window that didn't exist in my sandbox.
To get around this, you can append a script tag to the page and execute the code in the context of the page itself:
var code = function() {
    console.log(window);
};
var script = document.createElement('script');

script.textContent = '(' + code + ')()';

(document.head || document.documentElement).appendChild(script);

script.parentNode.removeChild(script);
This only works because of weird behavior in Javascript. When a function is cast to a string, you actually are returned the code that represents the function itself.
var test = function() {
    console.log("Hello!");
}
console.log("" + test);
/*

"var test = function() {

console.log("Hello!");

}"

*/
With this behavior, we inject the function's code into the context of the actual Plex webpage, allowing access to the same window variable the application uses and therefore allowing access to the Chromecast API.
Overwriting the Chromecast API
But, this is unfortunately only half the battle. Because the script is now injected just after the DOM has loaded, our code is executed before the Chromecast API is actually available. This means, if we run the Chrome extension as is, we will end up trying to overwrite some undefined variable.
To fix this, we can use the Chromecast extension's "on load" callback-- __onGCastApiAvailable. This is a special function, that when defined, will be executed by the Chromecast API once it is loaded. This is normally where you write your own code to setup your Chromecast application, and it is also where Plex initializes their own code.
This, of course, poses a problem-- if we define the __onGCastApiAvailable function, when the Plex application loads our code will simply be overwritten. Enter, Object.defineProperty:
The Object.defineProperty method allows us to essentially add a hook that runs when a property on an object is get or set. In this case, we want to say, "when Plex tries to set the Chromecast callback __onGCastApiAvailable, then overwrite it with our own function". We can do this quite simply:
Object.defineProperty(window, '__onGCastApiAvailable', {
    get: function() {
        // Run our injection code here
    return window.____onGCastApiAvailable;
},

set: function(a) {
    window.____onGCastApiAvailable = a;
}

});
As you can see, we are defining a function to be run when the __onGCastApiAvailable property on the window object is set and when it is retrieved. All we do is actually store Plex's specified callback function in another variable, with four underscores instead of two, and execute some code when the function is retrieved again.
Put together, our injection extension now hooks into the __onGCastApiAvailable function to overwrite the Chromecast API.
In the actual Chrome extension, there's some additional code that creates a very basic options page and uses the message passing API to communicate between the different Chrome sandboxes. This allows us to remove the hard coded "new" Chromecast application ID, and allows the user to change it on the fly in the Chrome extensions page.
To view the actual Chrome extension's source, you can visit the GitHub page:
Putting it All Together
Once the Chrome extension was built, all that was left to do was to test it out. A good way to do so is to use the Jellyfish bitrate test files. The Jellyfish videos are a series of files with different bitrates.
You can try this test yourself-- download the 20 mbps Jellyfish video and add it to your Plex server. With the injection extension disabled, I couldn't even get the file to play-- Plex simply complained that there was an unspecified problem. With the extension enabled, however, Plex happily "Direct Play"s the file4 with absolutely no stuttering.
This was an interesting exercise in reverse engineering, and I definitely enjoyed the challenge. However, Plex needs to see the value in removing this hard coded limitation by default, and allow for users with different setups to tweak their servers for their specific needs.
Despite the limitation remaining in place, in the mean time, you can always perform the fix yourself and go back to enjoying your high bitrate media. Enjoy!
- If the Plex team is really running into performance problems, they need to re-evaluate their testing setup. Not only have I gotten high bitrate video working fantastically in Plex, as detailed in this writeup, but other users have used other applications to stream higher bitrate content to their Chromecast. ↩
- There are many people that don't realize that changing the XML is useless in the Chromecast's case. You can verify this on your own Plex server by enabling the debug logs, and watching them as you cast a 12 mbps+ video to your TV. You will see a message indicating that the bitrate was locked to 12,000 kbps. You can also watch the server's processes-- you'll see the transcoder spin up and working hard. ↩
- When casting to a Chromecast, the application's name is displayed on the sender computer in the extension popup. Normally, Plex is shown as "Plex". When the injection was working, this changed to "HighBitratePlex", which was what I named my application in the Cast Developer Console. ↩
- "Direct Play" is a feature in Plex that streams a file directly to a client if it is compatible, bypassing the transcoder entirely. In this case, that means that our extension worked since Plex thought that the 20 mbps file was "ok to play" on the Chromecast. ↩
Ebola has been a big topic in the news lately, but just how bad is it, and how quickly is it spreading? As a part of a web programming course in the iSchool at the University of Washington, I developed an interactive visualization of the 2014 spread of the disease using D3 and web technologies.
The Ebola virus infects humans and other primates and is characterized by it's symptoms: fever, pain, vomiting, diarrhea, and a decline in function of the liver and kidneys. The disease is spread through direct contact with the bodily fluids of the infected, and kills 25 to 90% of patients.
Since March of 2014, Ebola has been spreading throughout Africa and to other countries such as the high profile cases in Spain and the United States. Using data compiled by Caitlin Rivers, a graduate student in computation epidemiology at Virginia Tech, I have developed a visualization of the spread of disease over time and throughout the world.
This project was created in collaboration with Dr. David Stearns at the iSchool.
How it's Built
The visualization was built with modern web technologies, and as a result, works only in modern browsers with support for a few key technologies-- namely, SVG. Coordination of the SVG objects was done with D3, a popular Javascript library for visualizations.
Building the Map
The map is the centerpiece of the visualization, which was quite easy to build thanks to D3's built in support for GeoJSON and plugins for TopoJSON. The TopoJSON data was generated using publicly available data from Natural Earth, and using a script provided by Mike Bostock.
Finding Data
Though the CDC provides some summary statistics on the disease, country and city level data is often scattered throughout reports published by different organizations. Fortunately, Caitlin Rivers and various other volunteers have been collaborating on a public GitHub repository that normalizes the data into CSV files.
Open Source
The source code is also available on GitHub.
Shortly after the sync applications were leaked early, Microsoft officially unveiled their latest wearable product-- the Microsoft Band. The Band is not a smartwatch, but rather a fitness centered wearable device with several smartwatch-like features. The device's claim to fame comes from its unique blend of 10 sensors that constantly input data and send it up to Microsoft's new Health platform.
I own and previously have used several wearable devices, including an early Timex Internet Messenger watch1, Cookoo, and Pebble. All of these devices had one thing in common-- they were first and foremost a watch. However, they were all augmented with some form of notification technology, whether it be a primitive pager-esque text notification system, or a full on interactive device as the Pebble is.
Wearable devices fascinate me because they show our ability to shrink mountains of technology into smaller and smaller packages. For a while, mobile phones got smaller and thinner, yet more powerful, every year. But we've recently seen a trend of bigger devices. The phones still are more powerful, but it is not quite as obvious that the technology is getting smaller and more efficient.
I've been quite disappointed with the recent influx of Android Wear watches, primarily due to their battery life. Oddly, one of the pain points of my Pebble is the battery-- and this is device that gets almost a week on a single charge. I know that despite the Moto 360's captivating looks and round screen, I would not regularly wear the device because I would forget to charge it. And then there is the pain of carrying yet another charging cord during travel, though this is a non-issue with the Pebble on short-to-medium trips2.
It doesn't matter if your smart watch can find the meaning of life itself-- no wearable device is useful if it is always dead, which is why I prioritize battery life ahead of most everything else. The Band is an interesting compromise between Android Wear devices and the Pebble. It is rated for two days of battery life, which I have found to be an underestimate, so that on the days day that I forget to charge the device, I do not just have a hunk of electronics on my wrist: the Band continues to plug along happily until I can make it back to my charger.
The issue of charging is slightly complicated due to the fact that it is designed to track your health metrics 24/7. Especially since the Band is designed to track sleep, during the time during which you charge most of your devices, the Band is still working for you. I've found that when I am sitting at my desk or getting in the shower, plugging in the Band for 15-30 minutes at a time at least twice per charge cycle (i.e. every two or more days) seems to work well.
Sensors and Hardware
Since the Band is primary a fitness device, it has several fitness-focused sensors including an optical heart rate monitor and GPS. The heart rate monitor is relatively accurate, and takes measurements for a single minute once every ten minutes during daily activity. During sleep, the device tracks your heart rate for two minutes once every ten minutes, and when running, the device tracks you heart rate once a second. The Band is not quite as accurate as other chest strap monitors, but it provides a fairly convenient way for the average person to measure their heart rate over the course of the entire day.
The GPS can be enabled when you go on a run. This is probably one of the most unique features of the Band: most fitness watches with GPS built in are bulkier than your average FitBit or Jawbone device, but the Band includes this without the significant bulk seen in devices such as some of the Garmin Forerunner models. I have not tried running with GPS enabled yet thanks to the near-freezing temperatures we have seen in Seattle, but in theory this will allow for people to leave their bigger phones at home while still tracking all of the same metrics. If you're a phablet lover, the iPod may once again be useful: an iPod Nano plus a Band together would make better running companions than your massive iPhone 6 Plus or Galaxy Note 4.
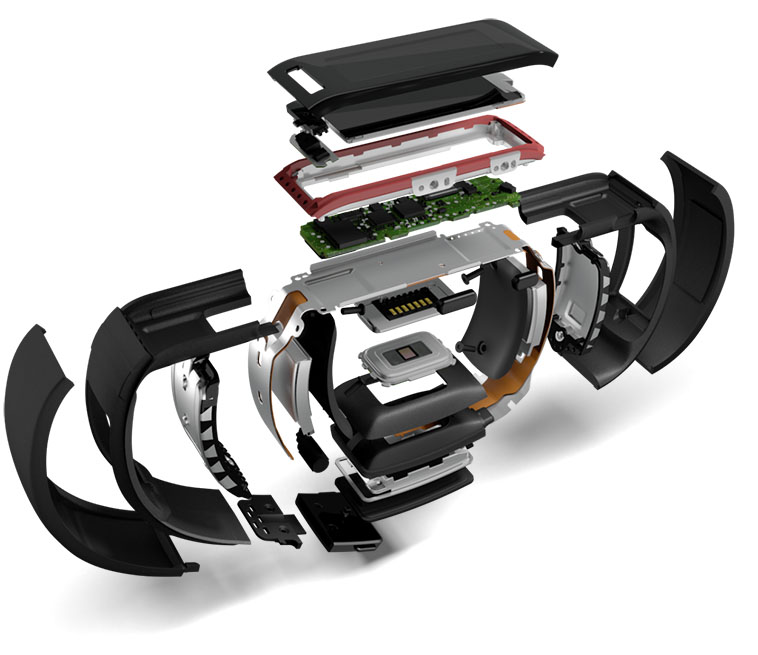
Other sensors included on the Band include an accelerometer, UV sensor, galvanic skin sensor, ambient light sensor, and microphone. The "10-sensor-package" is a great marketing pitch, but you actually won't find anything too novel in the Band other than the galvanic skin response and UV sensors as well as GPS-- the others I would expect any smart device to have.
The UV sensor is interesting, though it has little practical daily use. Unlike the heart rate monitor and accelerometer, the UV sensor has to be explicitly activated with one of the tiles on the Band. At that point, the sensor will collect some data over a couple seconds and let you know how long it would take, on average, for your skin to burn in the sun. Living in Seattle, this is practically useless at this point in the year since there is so much cloud cover and so little sunlight. It is one of those things that is cool to show off, but ideally this sensor would be used automatically and you would receive a notification or something if the sun was particularly strong one day.
The galvanic skin response sensor in theory can track things like stress levels, but I don't believe it has any particular use at the moment other than telling the band whether it is being worn or not. There are two contact points-- one under the screen, and one on the opposite side of the Band next to the heart rate sensor. Since the sensor itself is included in the hardware, I am looking forward to seeing whether Microsoft will enable any new features in the Band's software.
Many reviewers expressed concerns over the actual hardware itself and indicated they thought it was an uncomfortable device to wear. On one level, I agree-- you will probably notice you are wearing a new device at first. The Band has to be relatively tight to measure your heart rate properly (especially when you are jogging or doing physical activity where the device is moving around), and its stiffness keeps you from completely forgetting it's there. This is one area that devices like FitBit's, the Jawbone, and Nike FuelBand excel-- they are relatively discreet and light, so they're easy to forget about. The Band, however, is probably always going to pop into your mind, even after you get used to wearing it.
That isn't to say that the Band is completely uncomfortable. It's something that I notice, but also don't mind. The clasp is actually quite nice and allows for the device to be adjusted on the fly, so you can wear it more loosely during the day and tighten it up when running to ensure a better read on your heart rate. With my winter jacket on (and the Band underneath), it's hard to tell that the device is there because it feels similar to the way the sleeve fits around my arm. Certainly, I would suggest to try it on at a Microsoft Store to get a feel for it. The device may not feel fantastic at first, but remember that you will at least get used to the feeling.
The Band comes in three sizes-- small, medium, and large. I am a skinny 20-year-old male and opted for the small. The device fits tightly around my wrist at the smallest setting on the small Band, and with the largest opening it will slide relatively freely around my wrist. There seems to be a slight overlap on the sizes, so the largest setting for the small band is larger than the smallest setting for the medium. Again, this is something you will need to try for yourself at a Microsoft Store.
Fortunately, as mentioned earlier, the clasp is quite nice-- there are two buttons on opposing sides of the clasp that expand and retract pins on the inside of the band, which allows you to simply press and move the clasp to open and close it. There is a satisfying click when the clasp is secured, and it feels relatively solid. I wouldn't pull extremely hard on the two ends of the band to try and separate them, but it will definitely hold up to daily use and exercise. I actually tend to like this style better than a traditional watch strap-- the Pebble will come undone sometimes and the rubber "tail" will come out of the piece that is supposed to hold the loose end of the strap. This is never an issue with a clasp like that on the Band because there really is no additional "tail" section.
A lot of the photos you see of the Band show people wearing it on the inside of your wrist. While the Band does work both ways, you will likely do the same and have the Band on the inside. The issue is, if the band is on the outside of your write like most watches, you will never be able to look at the screen straight on-- it will always be at an angle. However, if you have the screen on the inside of your wrist, you can naturally bend your elbow in a way that makes your arm perfectly perpendicular to your body, and consequently have the Band's screen pointed directly at you.
Microsoft Band's Software
The Band is not a powerful device. It contains quite a few sensors, but only two 100 mAh batteries and runs on a low powered Cortex M4 MCU processor. It shows in the software in some areas-- scrolling, in particular. Rather than provide a buttery smooth interface like a smartphone, Microsoft has made the smart tradeoff of using a lower powered processor to provide longer battery life at the expense of software performance.
But, it doesn't really matter.
The software for the Band is actually quite good. Microsoft's "tile" aesthetic works very well with the band form factor, and though the horizontal scrolling on the home screen is somewhat tedious, it is passable. Honestly, I only scroll through the menu once per day, and that is to invoke the sleep application.
The Band is slightly more utilitarian than other devices, such as the Apple Watch-- there's no fluid zooming animations or other embellishments, but the Microsoft "tile" style both looks good and functions well.
The minimalistic interface is composed of text and rectangles. In fact, you will really only see the colors black, white, and the accent color you've chosen for your wallpaper. Only the Starbucks app uses anything other than these three colors as far as I've seen. Though I appreciate Starbucks's desire to keep their branding, the green icon looks quite out of place in the row of monochrome, minimalistic glyphs.
The first tile-- called the "Me" tile--takes up the entire screen initially. It contains the time, and another metric of your desire-- current date, steps, calories burned, distance, or heart rate. The secondary metric can be changed with the action button. Tapping on the "Me" tile brings up a horizontally scrolling list of the aforementioned metrics-- nothing too exciting.
The other tiles on the main menu represent different hubs for notifications, as well as apps. The message, email, calendar, and notification center tiles simply collect their respective notifications. The notifications are displayed in a horizontally scrolling list of items, and messages that are too big for the line or two of vertical space available will scroll vertically as well. The vertical scrolling is not ideal-- the screen is too small to really make scrolling up and down worthwhile-- but it does function as you'd expect. I do prefer the Pebble's screen for longer notifications, as well as the physical button controls that are used for scrolling on that device.
With an iOS device, incoming notifications trigger a subtle vibration in the Band with the option to dismiss the notification on the phone. This is actually a big plus for the Band. Unlike other fitness devices, you can at a glance see who is texting, calling, or emailing you. By including notifications, Microsoft has made a bridge between a serious fitness device and a smartwatch-- one that many everyday people will want to take advantage of.
These "smartwatch" features go even further if you have a Windows Phone-- you have access to Cortana through the built in microphone, and you can speak to her to set reminders, ask questions, or perform other tasks like play music.
Daily activity, including walking, is tracked fairly accurately. The measurements between my phone's internal accelerometer (with Apple Health) and the Band's statistics are close enough.
Sleep is also fairly easy to track-- you simply have to navigate to the sleep tile and hit the action button to let the Band know you are in bed. The actual, calculated time slept will actually be different than the time you press the action button to indicate you are going to sleep, which is nice. Obviously, you will never fall asleep instantly, so you do not have to worry about tossing and turning messing up your actual sleep statistic. The Band will still let you know how inadequately you are sleeping, even if you are "in bed" for 12 hours.
The workout and run tiles are essential to the Band's functionality, but at the same time, are incredibly simple. After tapping on either of the tiles, you can hit the action button on the device to start and stop the activity. Before starting your run, you can also swipe over and turn GPS functionality on, though this will dramatically decrease the battery life.
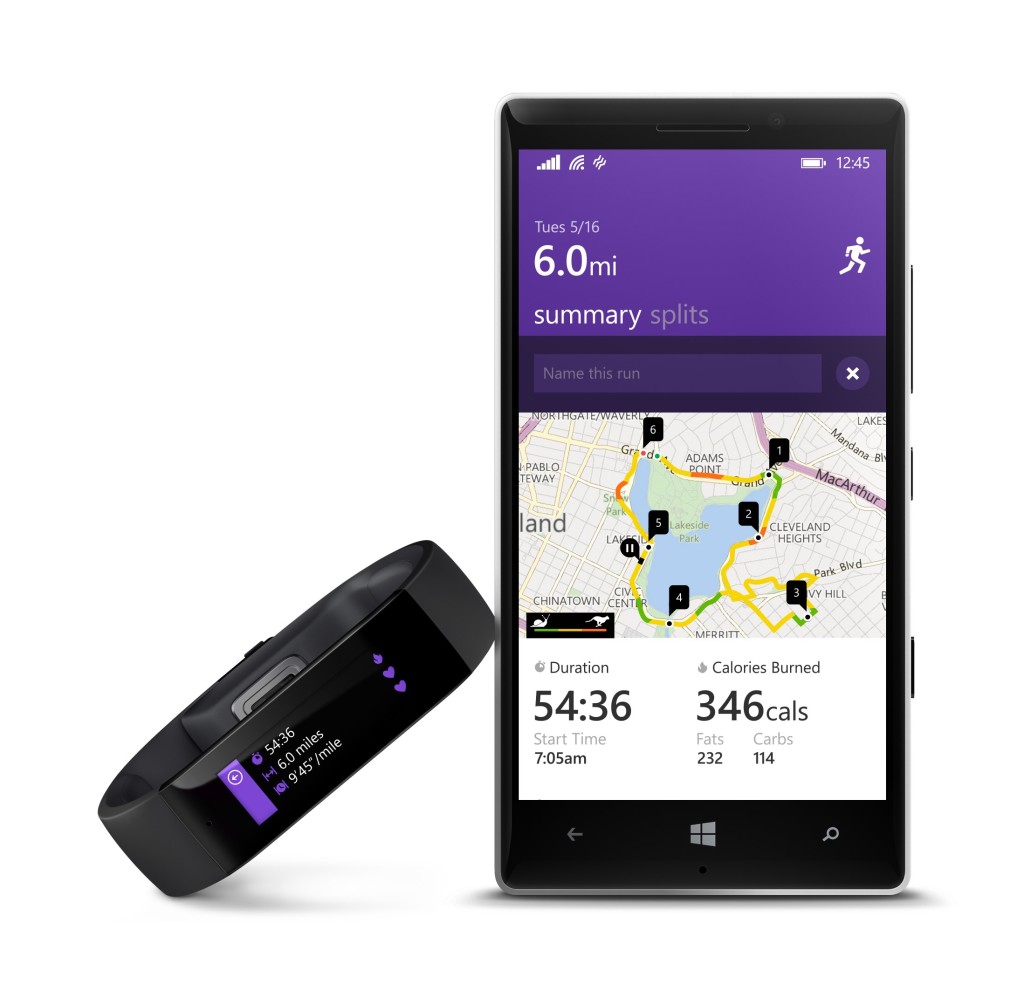
There are a couple of other cool features fitness wise, including guided workouts. This allows you to download a workout from someone-- Gold's Gym, for example-- and have it uploaded onto your Band, which measures your movements and determines how well you are performing, along with counting your reps and heart rate. Once again, this is a feature I have not tried out yet and likely will not use extensively3, but more information on guided workouts can be found elsewhere on the web.
Sync Software
The Band connects with Microsoft's new Health platform, which is available on Windows Phone, iOS, and Android4. Additionally, there are sync apps for Mac and Windows, so I suppose you could regularly use the Band without a smartphone if you really wanted to, though you would miss out on a lot of cool features.
The mobile phone apps all look the same and have the same style. They seem to be relatively consistent, which is actually quite impressive for a cross platform effort.
However, on iOS, I had some pretty significant trouble actually pairing the device initially. After turning the Band on and pairing it with my phone, I received a "Network Error" indicating that I had no internet connection-- completely untrue. Hitting retry simply brought up the same dialog box, and switching between WiFi and LTE did nothing. I was stuck, and there was no way to restart the "Getting Started" wizard since my Band simply said "Almost There" and did not respond to any interaction.
After something like 30 minutes of fiddling around with the retry button, closing the app, and rebooting, I forgot the Band from my phone's Bluetooth settings. This time, I didn't even get as far as I previous attempt-- the Band didn't show up in my Bluetooth settings at all, with no way to pair with the device. Furthermore, at some point, devices named "Accessory" kept appearing on screen, making an endless list of "Nearby Devices"-- all titled "Accessory".
Eventually, after a trip (back) to the Microsoft Store to fiddle with the device in front of the employee, I managed to re-pair the Band and set it up successfully. The initial setup experience is crucial for any device, and the friction required to get this Band setup was immense. I do not know what caused the long chain of events I experienced, but the fact that there seems to be no documented hard reset key combination is a little frightening. If a user, for some reason, cannot access the factory reset menu inside of the Band's software, how can you re-pair the device?5
After sleeping with the Band and waking up in the morning, I left my phone in my bedroom as I worked elsewhere. A few hours later, I had trouble syncing with the app, and it appeared the only way to re-sync was to do a complete factory reset of the Band and un-register the device from the app. Starting from the beginning worked fine, though it was a massive pain, and I lost about 400 steps worth of data in the morning from shuffling around the apartment.
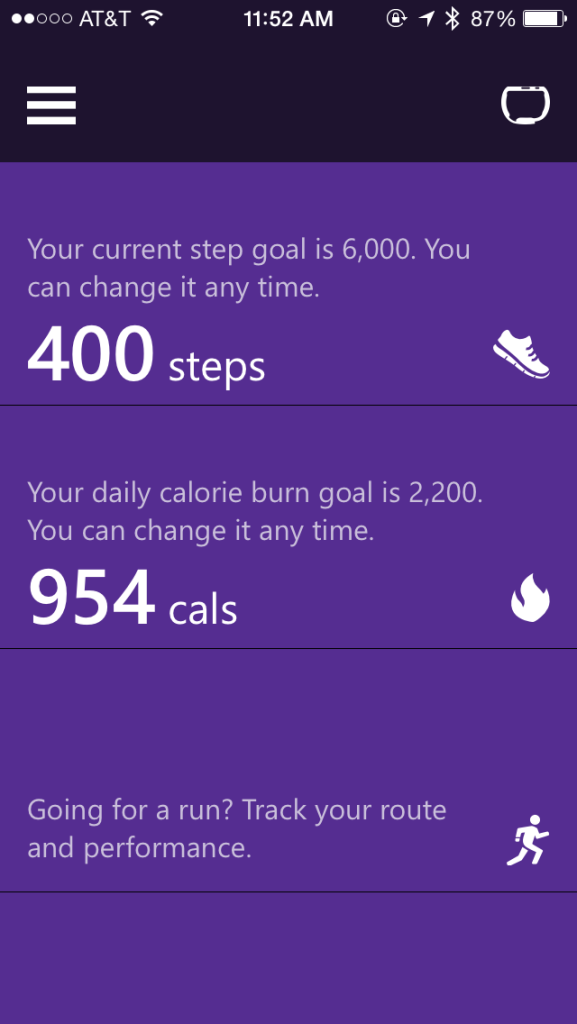
Once setup is complete, the actual Band smartphone software is alright functionality-wise. There's a list of tiles like what you'd see on the Windows Phone start screen that contain information on your current steps, calories burned, runs, exercises, and sleep. It's a relatively effective dashboard that lets you know how you're doing today, without being overwhelming. Of course, all of this data is synced over Bluetooth periodically, so it may lag behind by a couple hours to an entire half-day. That's fine, because you can simply trigger a manual sync if you're desperate to see the latest information on your phone. This info is also available at a glance on your Band at a lesser detail level, so there's no real need to look at the dashboard itself if you're just checking out how you're doing on steps for today.
Delving into more complex charts in the apps is quite easy. For example, your daily walking activity is broken down by day and charted by the hour, and allows for displaying either the number of steps you took over each hour of the day, or a graph of your heart rate. Previous days are easily accessible by scrolling down below the "today" graph, and weekly summaries are available by swiping to the side.
Sleep charts are also quite simple, and look similar to what you might see on a sleep tracker application for your phone. Of course, this is because the Band is tracking the same sort of metrics the phone apps do, just with higher accuracy (the accelerometer is directly attached to you) and with a heart rate. If anything, the Band seemed to be overly sensitive and indicate I woke up more than I did-- maybe I'm just a restless sleeper.
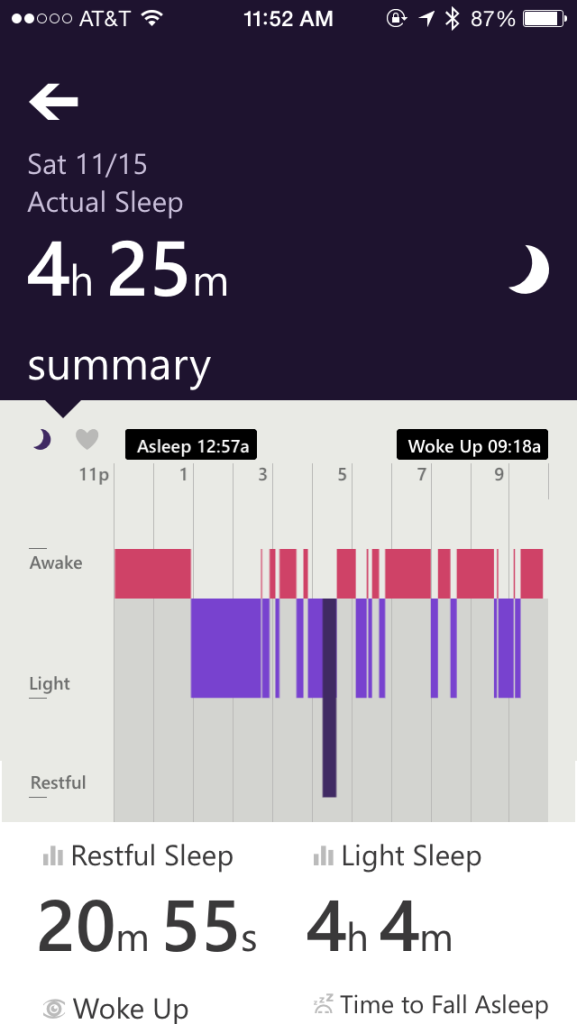
I personally have used a sleep tracking application for quite a while on my iPhone, though more recently for the "silent" (i.e. vibrating, rather than a blaring sound) alarm than the actual sleep tracking. While I periodically look at the chart to say, "huh, I slept XX hours last night", there's not much you can do with the data. Sure, you can see when you didn't sleep well or how often you woke up, but is this information truly useful? Not really.
Regardless, it is still quite cool to see metrics such as your heart rate tied to your sleep. I currently have a cold, so my trip to the bathroom to clear my nose at 6 AM is quite obvious on the heart rate graph as well as the motion graph. Again, I already knew that I was having a bad night's sleep, but I suppose the fact that I only slept for around 4 hours is interesting if true6.
Personalization
The Band is relatively customizable, though not to the same extent as other smartwatches. Though you can't have custom watch faces like the Pebble or Android Wear, the Band provides quite a few different colors and backgrounds. There's no free-form color picker, however, so if you dislike all of the provided colors, you're out of luck.
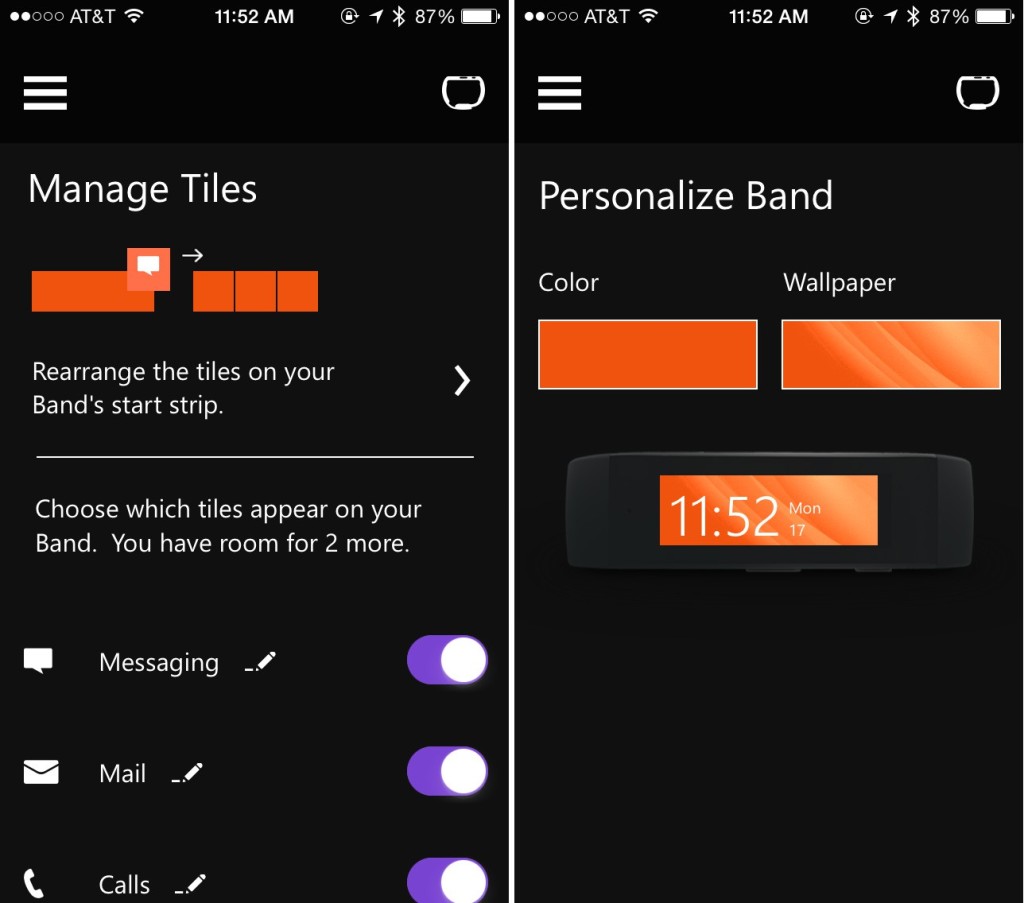
The tiles can be rearranged, added, and removed at will, though saving any customization options results in a somewhat lengthy "sync" process. I would expect a simple color change or tile rearrangement to occur in milliseconds, but sadly this is not the case. However, you will likely perform this process five or six times when you initially receive the Band and never have to do it again, so it's only a minor annoyance.
PC/Mac Software
Conveniently, there is Mac and PC software available to sync your Band. It is completely unnecessary if you have a smartphone, but supposedly it is faster than syncing with the phone. Of course, this is only true if you forget about pulling your USB cord out and attaching it to your device. Honestly, I don't see using the desktop software much. I really only booted it up to try and finish setup when the Band was initially borked.
The software itself is relatively basic, but it is just functional enough to sync your data. It, like the smartphone software, is linked to your Microsoft account so all of your data will be stored in the same place. In the event you sync using your computer, you should still be able to see the same information on your phone.
Conclusions
Microsoft is really on the right track with the Band. Not only does the device have an extremely good feature set, but the software and hardware all actually work well. There are a couple things that I think Microsoft really missed out on:
- The Band is not waterproof. Considering a big part of the Band is the guided workouts, which detect how you are performing, it would have been fantastic to have the Band coach you through your swimming strokes.
- They didn't actually make enough hardware.
The waterproof issue is more of a minor point. It's a feature that would have been cool to have, but the level of water resistance the Band currently meets means that you won't be in danger of ruining your Band if you get caught in the rain on the way home. Maybe for version 2.
However, the Band has been almost impossible to find in stores-- you're pretty much required to backorder the device and hope it shows up in a couple weeks in Washington, though the store associate seemed to suggest some store in Texas had a ton of them that weren't selling and needed to be redistributed. Microsoft actually has demand for the device, and despite it being a showcase for their Health platform and sensor technology, they should have been able to meet (or scale up to meet) the demand-- especially since it's the holidays and a lot of people will be looking for gifts.
Over the next year or so, I am interested to see where Microsoft takes their Health platform. They seem to have ambitious goals, but right now it's unclear when or if they'll meet them. They have to sell hardware that interfaces with Health first, and so far they are off to a decent (if slow) start.
- This was an early form of a smartwatch that essentially was a pager and digital watch in one device. My parents would use it to let me know when it was time to come in from playing, way back when. ↩
- Weekend trips to visit my grandparents often last no more than four days, which is easily doable on the Pebble's battery life. Journeys to places much farther away (i.e. internationally) normally last one to two weeks, so the Pebble is normally just left behind since there is no cell service anyways (as a result, there are also no notifications to see on the watch). ↩
- My exercise generally consists of running, but not other "exercises" like the kind you'd find from the guided workouts feature. Though, there are some cardio/running guided workouts for the Band which I may try at some point. ↩
- Bluetooth 4.0 is required as the Band uses Bluetooth LE, so check your Android phone before purchasing a Band. The iPhone 4S and newer has Bluetooth 4.0 built in, as do Windows Phone 8.1 devices. ↩
- To be fair, setup was painless for another family member's Band. It was likely circumstance or something I did that started the endless "Network Error" messages. ↩
- Did I actually get up 12 times and only sleep for about 4 hours? I don't know, but it sure felt like it. I'm inclined to call it accurate. ↩
I recently purchased a diskless ReadyNAS 104 device from Netgear and filled it with a trio of WD Red 3 TB drives for my personal file storage. In this configuration, the NAS has a capacity of approximately 6 TB (one of the disks is used for parity), and houses backups of my files, photos, and home videos.
But, considering the device is attached to my apartment's WiFi network, it's not so useful outside of the premises. Netgear provides a client application called "ReadyNAS Remote", which provides remote access to the NAS device presumably by relaying your traffic through one of their servers. However, this can be slow and potentially a security concern. As an alternative, I compiled ZeroTier One, a mesh VPN, to connect to my NAS remotely.
ZeroTier One is an open source mesh VPN software similar to N2N or Tinc. However, unlike N2N or Tinc, ZeroTier provides easy to use client applications to configure the network and handles both authentication and network management for you. This is similar to how LogMeIn Hamachi behaves, which also provides a web interface for creating networks and approving clients.
Registering for ZeroTier
ZeroTier's client software is open source, though they do provide a premium service for free that allows you to connect more than 10 clients to a private network. However, if you'd like to run a private network with more than 10 clients for free, you can still do so by running the software on your own servers1.
Once you register for ZeroTier on their website, choose a name for your network and register it. After you've registered the network, you'll see some configuration options:
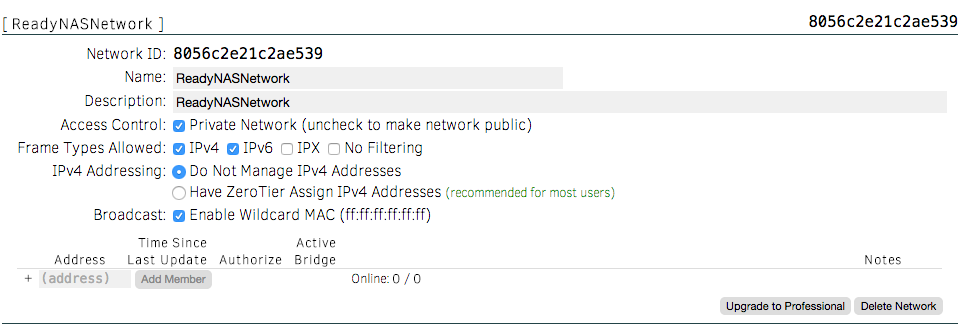
Ensure that the "Private Network" box is checked (it is by default), and go ahead and select "Have ZeroTier Assign IPv4 Addresses". This will allow ZeroTier to essentially act like a DHCP server for your VPN network. Any netblock can be used-- it's all based on your preference and whether any networks you use already use the netblock.
Installing the ZeroTier Client
The VPN clients for Mac and Windows are fairly straightforward to install. You may go ahead and install the clients onto the machines you wish to access the NAS from. Once the clients are installed, simply enter the network ID (as seen in the administration panel) into the text box in the bottom right hand corner of the ZeroTier window and click the plus.
You will see an "Access Denied" message once you've added the network because you must authorize the client from the web admin page. Go ahead and go so by checking the box next to the new client listed in your admin panel under the network you created. You may also want to give the client a descriptive name so you may identify it later.
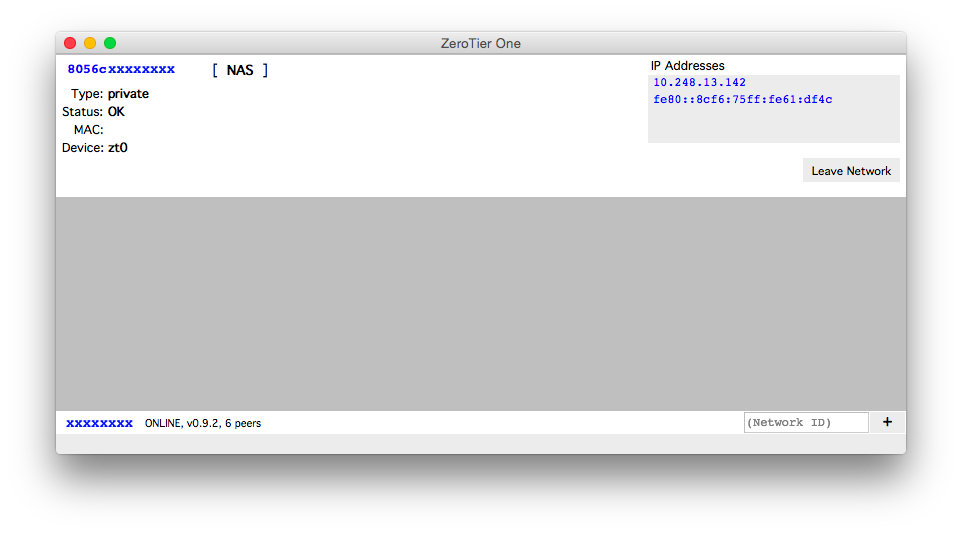
The client doesn't have much to configure-- most of the configuration, such as static IP address assignments, are done from the ZeroTier administration interface.
Compiling ZeroTier One for ReadyNAS
The ReadyNAS 102 and 104 are ARM devices running a lightweight version of Debian Linux. However, currently ZeroTier doesn't provide an ARM download for the client, so we must compile it ourselves. First, you must enable the SSH service from your ReadyNAS administration console. This can be found under "System" > "Settings".
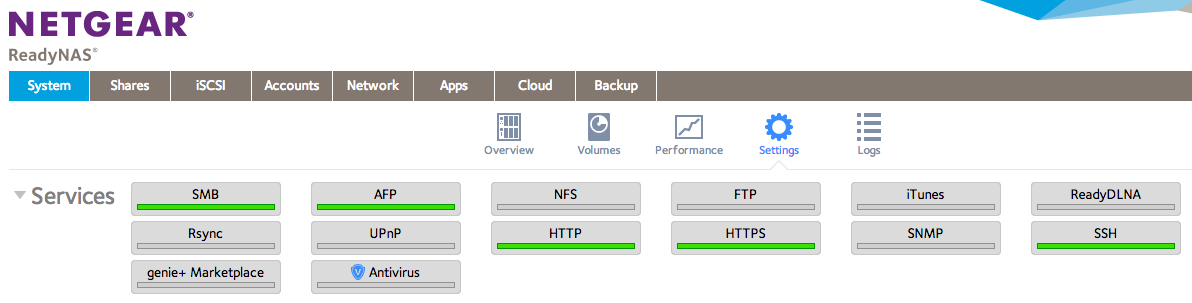
Once SSH is enabled, you can login to your NAS as the "root" user with the same password that's set for the "admin" user on the front end. We'll need to add some software to compile ZeroTier-- namely, Git and the build tools. This can be done with a couple commands:
apt-get update
apt-get install git build-essential
Once this is completed, we'll need to get the source code for the ZeroTier client.
cd /tmp
git clone https://github.com/zerotier/ZeroTierOne.git zerotier
The main branch of the ZeroTier source code repository is a little old and doesn't have some fixes required for ARM devices, and we must use the adamierymenko-dev branch. The below commands point to the specific commit I compiled for my ReadyNAS:
cd zerotier
git checkout d37c3ad30f23f4c2dda23dfac6852dddde6af18d
After the branch is checked out, you can run make in the ZeroTier One directory to compile the binaries. This will take a couple minutes because the ARM processor on the ReadyNAS is quite slow compared to a typical x86 desktop.
Once the software is compiled, you'll have a couple binaries in the ZeroTier directory: zerotier-cli, zerotier-idtool, and zerotier-one. The two most important tools are zerotier-cli and zerotier-one. The latter is the service that runs to connect to the ZeroTier network and your other clients, while the former controls the service and commands it to join and leave networks.
You probably want to move the binaries to another location that isn't the temporary directory:
mkdir -p /usr/local/zerotier
mv zerotier-* /usr/local/zerotier/
After this is done, you can launch the ZeroTier service in the background:
/usr/local/zerotier/zerotier-one &
We also want to run the ZeroTier service at boot and stop it before shutdown. This can be done by creating a new file called /etc/init.d/zerotier-one with the following contents:
#! /bin/sh
# /etc/init.d/zerotier-one
BEGIN INIT INFO
Provides:          zerotier-one
Required-Start:    $network
Required-Stop:
Default-Start:     2 3 4 5
Default-Stop:      0 1 6
Short-Description: ZeroTier One VPN
Description:       ZeroTier One service launcher
END INIT INFO
case "$1" in

start)

echo "Starting ZeroTier One Service"

/usr/local/zerotier/zerotier-one &

;;

stop)

echo "Stopping ZeroTier One Service"

killall zerotier-one

;;

*)

echo "Usage: /etc/init.d/zerotier-one {start|stop}"

exit 1

;;

esac
exit 0
Additionally, the script must be made executable:
chmod +x /etc/init.d/zerotier-one
Once this is done, you can run update-rc.d zerotier-one defaults to run the script and boot and shutdown. You can also run service zerotier-one start and service zerotier-one stop to start and stop the service.
Configuring ZeroTier
Now that you have compiled the ZeroTier service for your ReadyNAS system, you can run the CLI to join your NAS to your network. Documentation for the CLI is provided on ZeroTier's GitHub Wiki, but the command to join a network is simple:
/usr/local/zerotier/zerotier-cli join <network ID>
Simply replace "
You can also set a custom IP address for your NAS by clicking the edit icon in the "Assigned Addresses" column of the client list. Enter an IP address, and after a minute your ReadyNAS should be usable at your custom address.
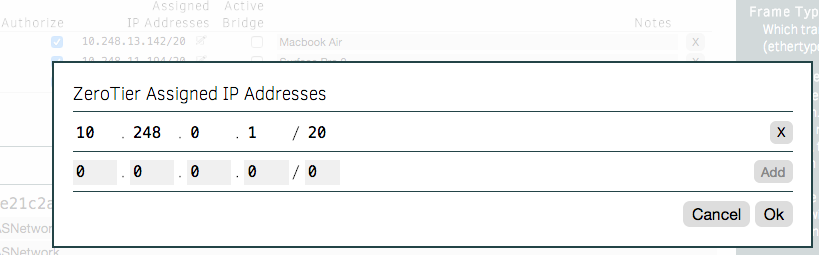
Now you can visit the IP address in your web browser to view the admin console of your ReadyNAS device, or connect to AFP/SMB/NFS. This same IP address will work regardless of whether you're on the same physical network (or a different one) as your NAS. Additionally, because ZeroTier is a mesh VPN, your traffic will also take the shortest route possible, which is often a direct connection from your computer to your NAS. If you are behind a strict firewall, ZeroTier's supernodes will route your traffic between your devices for you, though this is unlikely to happen given the number of firewall-punching techniques embedded in the VPN software.
So far, the ARM based device has proved plenty capable and for a significantly lower price than most other NAS systems would come out to2. Combined with ZeroTier and CrashPlan to backup the critical data, the ReadyNAS 104 is a great little home/small business-class NAS that allows you to access your files from anywhere.
- The software is open source, but lacks documentation and is not trivial to setup. Additionally, you may also be required to run "supernodes", which is simply a client that is used to relay traffic between two devices on a strictly firewalled network. The software for a "supernode" is the same as any other client, but usually it is run on a VPS or other server. ↩
- Amazon had a sale of the ReadyNAS 104 for ~$200, which is a good $60 off of what it is now. ↩
The world of Docker has had some very exciting releases lately. From the self-hosted PaaS Flynn having their first beta release, to the 1.0-and-beyond release of Docker itself, to the new Docker web UI from CenturyLink called Panamax and based on CoreOS, Docker has become easier to use for newcomers.
Today, I'll briefly go over how to setup and use one of these tools--Panamax--and create your own application template to produce a fully internet-accessible web application that requires zero configuration.
Docker? CoreOS? Panamax?
For those that are new to the world of Docker and friends, it may be beneficial to get an overview of how Panamax fits it--
CoreOS, a minimal operating system, is designed to work hand-in-hand with Docker-- a container management system. A container is in concept very similar to a virtual machine, since it allows for isolation of processes. Though, unlike a full blown virtual machine, a Docker container is extremely lightweight and can launch in seconds.
Docker is an extremely powerful tool, but at the same time, it is not accessible to all developers due to its command line interface, necessity for knowledge of how containers behave, and requiring for the developer to know how to edit the manifests called "Dockerfiles". This is where Panamax fits it-- Panamax provides a friendly web interface for coordinating the launch of different types of containers, such as a database and web server, and focuses on easy of use.
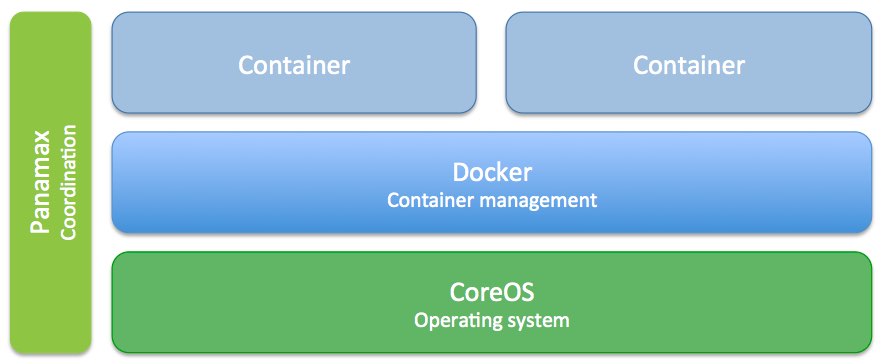
Panamax includes the ability to create application templates, or a manifest defining a set of containers to launch, as well as a repository to host this information. Historically, you've had to use the command line to use Docker with commands such as docker pull wizardapps/ngrok. After you had pulled all of the containers, you could then manually link and run them.
Now, with Panamax, this same sequence of commands is abstracted away with a single "Run Template" button. These templates are both CenturyLink and community provided, and are based on the same Docker container templates that are available in the registry. However, with Panamax, all of the linking and launching is automated with CoreOS and Fleet.
Currently, Panamax is single-host only, but CenturyLink plans on implementing multi-host support.
Installing Panamax
Due to being based on CoreOS, Panamax is currently only available as a virtual machine in Vagrant for local development. In production, you can install Panamax on various cloud providers, though it is not currently recommend due to Panamax being a new release.
No matter which platform you intend to install Panamax on, you must have two things already installed on your computer-- Vagrant and VirtualBox.
As of this article the required versions of the above software are:
- VirtualBox 4.2 or higher
- Vagrant 1.6 or higher
For an up-to-date list of required software, you can check the Panamax wiki.
Mac OS X
Mac OS X users can quickly get up and running with Panamax with a single command1:
brew install http://download.panamax.io/installer/brew/panamax.rb
After Panamax is downloaded and installed, it only takes a panamax init to bring up the CoreOS VM with Panamax preinstalled. Once the initialization command is finished, you'll see the UI pop up in your browser on port 8888.
Linux
Similar to Mac OS X, Ubuntu desktop users (12.04 and up) can run a single command:
curl http://download.panamax.io/installer/ubuntu.sh | bash
Panamax for Ubuntu will automatically open a new browser window when it is finished installing-- no need for panamax init
Basic Usage
Panamax has a couple basic commands that are important to know, though you can view all of the available commands simply by running panamax.
panamax up
The panamax up command brings the Vagrant machine running Panamax up. You can use it after rebooting your computer, for example.
panamax stop
As the name states, panamax stop will stop the Vagrant VM.
panamax restart
In reality, this is the same as a panamax stop; panamax up.
panamax reinstall
The reinstall subcommand will delete your applications and CoreOS Vagrant VM and then reinstall it. This command is useful when you need to start fresh.
You can also run panamax reinstall --memory=3072 or similar if you'd like to create a VM with more than 1 GB of memory. Personally I found the default 1 GB RAM virtual machine to be sluggish and hard to work with-- after increasing the RAM to 3 GB, the problems went away.
Launching an Application
After you have Panamax running, a good next step is to launch a pre-built application.
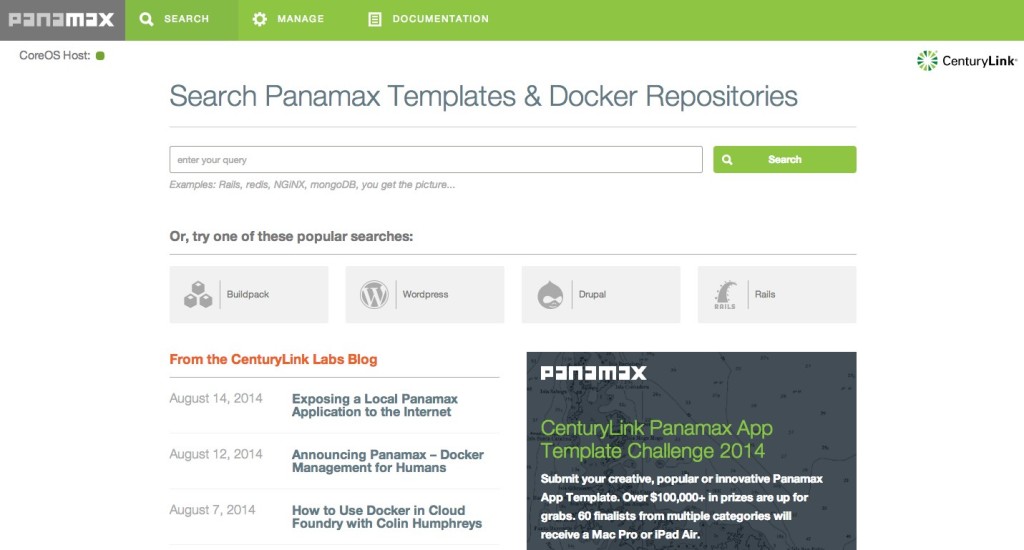
The dashboard, shown above, has several options. Most prominently you can see a search bar, which is your gateway to the Panamax template repository. The repository currently contains several applications such as Wordpress, GitLab, and others-- all pre-configured and ready to go.
Go ahead and start a search for "Ngrok + Wordpress"-- this is an application template I've created that expands on the basic Wordpress template available2.
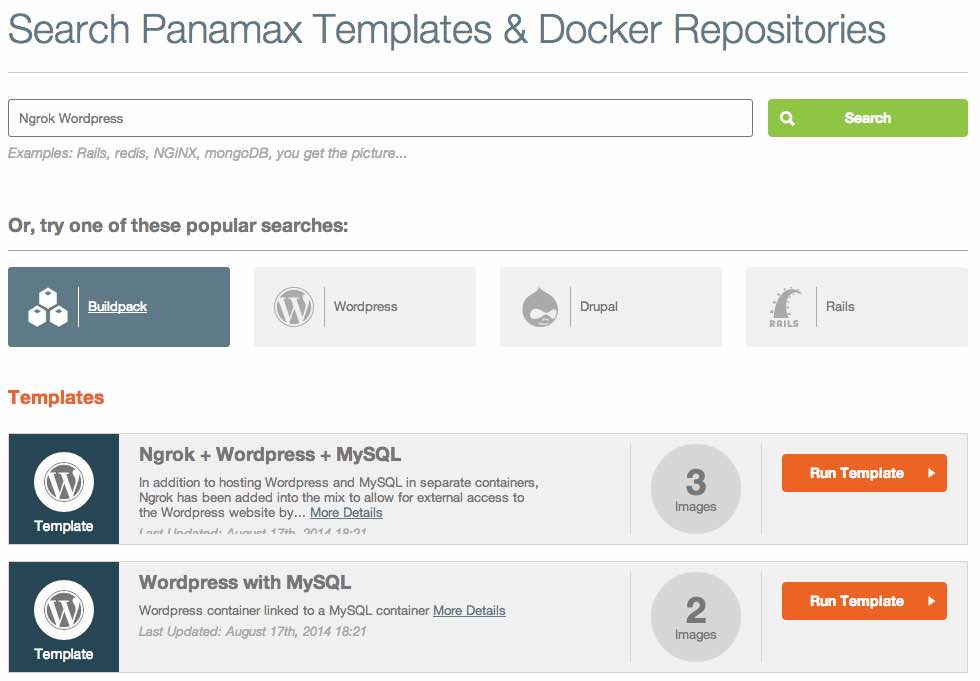
If you simply click on "Run Template" next to the "Ngrok + Wordpress + MySQL" template, you'll be brought to a new page with information on your application launch.
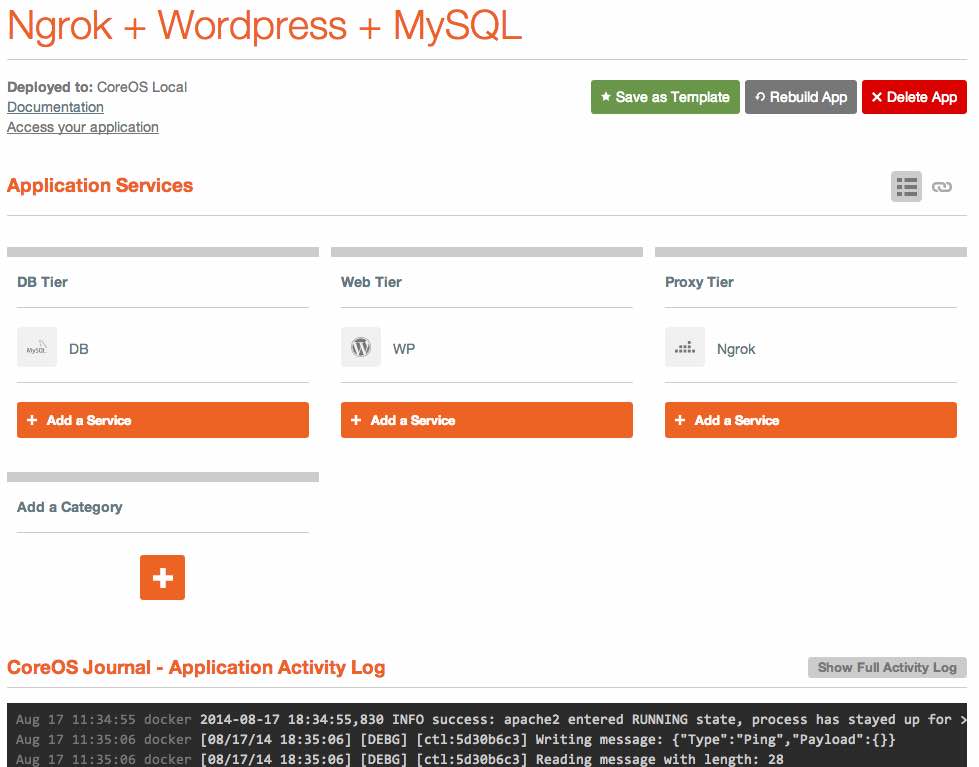
After a few seconds, you should see a message in the "CoreOS Journal" at the bottom of the page that says INFO success: apache2 entered RUNNING state, process has stayed up for > than 1 seconds (startsecs). If you see this, it means that everything is now up and running.
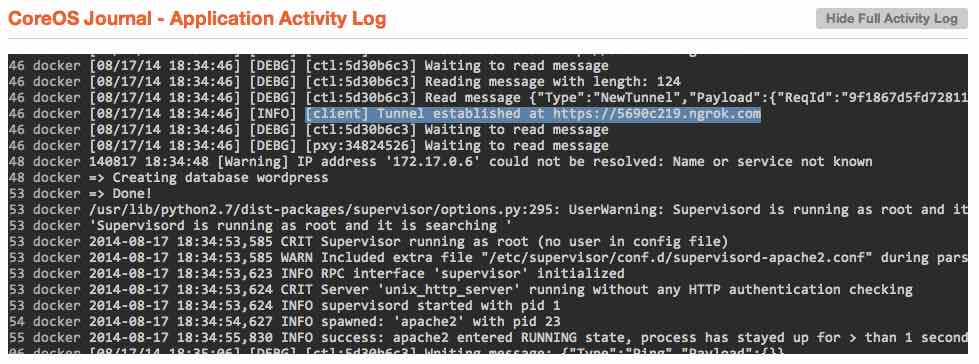
To find the publicly accessible URL, you only have to hit the "Show Full Activity Log" button above the application logs, and scroll up until you see a message that states something similar to [client] Tunnel established at https://5690c219.ngrok.com.
If you copy and paste the URL into any browser-- it doesn't have to just be on your local machine-- you'll see the Wordpress installation page pop up.
How does the Ngrok container work?
Though you may already be familiar with Wordpress, Apache, and MySQL, Ngrok may be a new concept.
Ngrok is essentially a service that creates a local tunnel from your machine, or in this case your Panamax VM inside of VirtualBox and Vagrant, are makes it accessible from the outside internet over a random subdomain. Ngrok is quite useful in scenarios where you must show a co-worker or client something that is running on your local machine, but it also makes it possible to create a publicly accessible URL through a strict firewall (or a virtual machine) without any port forwarding.
You may be asking, why would you use this complicated tunnel over simply running an app directly in Panamax? As it stands, since you must use VirtualBox to try out Panamax locally, you must perform some no-so-complicated-but-tedious steps to actually see your application in a local browser. Sure, you could follow the port forwarding instructions provided, but why do this when you can have a zero-configuration internet-accessible address you can visit from any of your devices?
In context of Panamax and your newly running Wordpress installation, Ngrok is actually running in a separate container and automatically configured through Docker links.
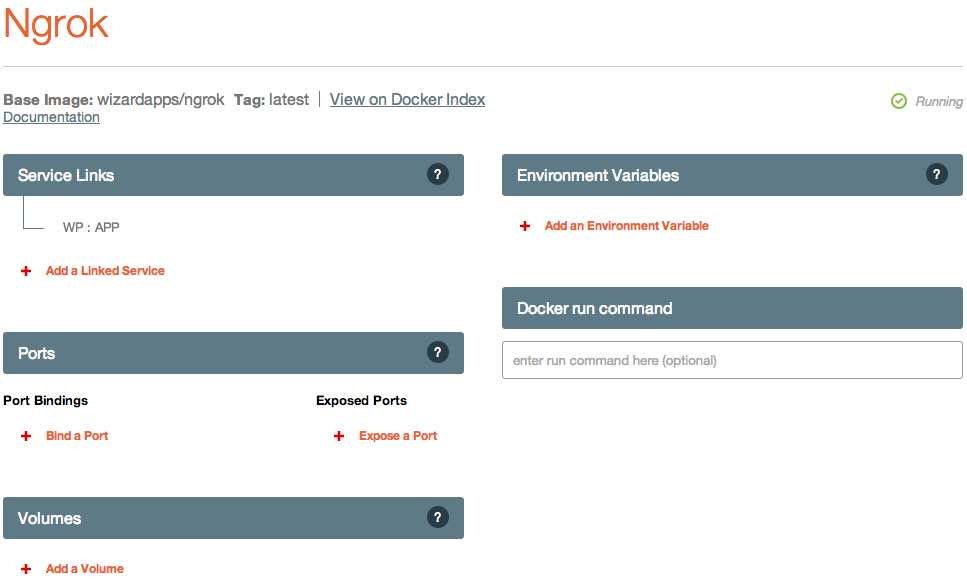
If you look at your application's page in Panamax, you'll see three tiers-- a "DB Tier", "Web Tier", and "Proxy Tier". Each "Tier" is simply a logically grouped set of containers. I've chosen to separate out each type of container based on its purpose, but this was completely arbitrary. If you create your own application template, you could put everything under a "Foobar Tier" if you wish-- there is no functional difference.
Clicking on the "Ngrok" container filed under the "Proxy Tier" category, you can see some of the inner workings of Panamax, including options for service links, ports, volumes, and environmental variables.
Ports
The ports category contains configuration on which ports are exposed or bound to the CoreOS host. This section corresponds to the Docker concept of exposing a port or binding it to a specific port on the host OS.
Volumes
The volumes section allows for you to attach volumes to the Docker container. For example, if you are creating a database container, you may wish to persist the data by mounting a volume from the host to the container.
Environmental Variables
The environmental variables section is one of the most important-- it allows you to configure your container through, you guessed it, environmental variables. For example, as I will show later on, my Ngrok container can be configured with a custom subdomain using these environmental variables.
Service Links
The final section available for configuration, and perhaps the most important for the Ngrok container, is the Service Links section. You can see a single entry containing the text "WP:APP". This single line is the magic that makes your Wordpress application accessible from outside the local VM and available to the public internet.
You may notice that other than this single link, there are no options specified to configure the Ngrok container-- no ports, IP addresses, or anything else. Like I said, by using the Docker links feature (which, is also available over the CLI3), we can make the Ngrok tunnel auto-magically configure itself.
The line "WP : APP" indicates two things:
- The Ngrok container should be linked to the "WP" container
- The "WP" container should use the alias name "APP"
The first point is not quite that exciting. However, point number two allows for the automatic configuration to "just work."
You see, the Ngrok container looks for three different environmental variables to configure itself from. In the order that the container looks for them:
- HTTPS_PORT
- HTTP_PORT
- APP_PORT
But, we never actually configure any of these environmental variables, so how can it be that Ngrok auto-configures itself? The secret is that Docker creates these variables automatically due to us linking the containers together.
If you read the Docker documentation on the links feature, you can see that several different environmental variables are created based on the link alias name:
APP_NAMEAPP_PORTAPP_PORT_[PORT]_TCPAPP_PORT_[PORT]_TCP_PROTOAPP_PORT_[PORT]_TCP_PORTAPP_PORT_[PORT]_TCP_ADDR
This is where the "APP" alias comes into play-- had the Ngrok container linked with Wordpress under a different alias (say, "WP"), the environmental variables would change to reflect this (WP_NAME, WP_PORT, etc.).
As for the variable contents, the APP_NAME is self-explanatory and not quite relevant for our use case. The APP_PORT variable, however, contains the important information for the Ngrok container to auto-configure. As you can see, it contains a protocol, IP address, and port of the linked container.
The APP_PORT_[PORT]_TCP variables contain specific configuration for multi-port-exposed containers. For example, RethinkDB uses several ports-- 8080 for the web UI, 28015 for client connections, and 29105 for intra-cluster connections. If we were to create a RethinkDB container and expose all of the previously listed ports, containers linked to the RethinkDB one would then have variables like RETHINKDB_PORT_8080_TCP_PORT, RETHINKDB_PORT_28015_PORT, etc.
In our case, Wordpress (rather, the Apache server that is serving Wordpress) only uses a single HTTP port, which is automatically placed into the APP_PORT variable.
In the startup script for the Ngrok container, you can see that we take the APP_PORT (or HTTP_PORT or HTTPS_PORT) variables and strip the protocol off.
if [ -n "$HTTPS_PORT" ]; then
  FWD="`echo $HTTPS_PORT | sed 's|^tcp://||'`"
elif [ -n "$HTTP_PORT" ]; then
  FWD="`echo $HTTP_PORT | sed 's|^tcp://||'`"
elif [ -n "$APP_PORT" ]; then
  FWD="`echo $APP_PORT | sed 's|^tcp://||'`"
fi
This is then passed to the Ngrok program, which creates a tunnel to the Ngrok service and forwards traffic to the specified $FWD address.
If we were to use the alias name "HTTP" for the link, Ngrok would actually still configure itself properly.
So, given what we've learned, we now know how the Ngrok container auto-configures itself. In the application template I created I specified that three containers are to be launched-- one Wordpress, one MySQL, and one Ngrok. I also specified that the Wordpress container be linked to Ngrok under the alias "APP" so that the proper environmental variables are in place, and the MySQL container linked to the Wordpress one (for similar database-auto-configure functionality).
All of this happens as soon as you click the "Run Template" button, without you ever having to think about it. Quite cool, huh?
Now that you know how the Ngrok container links and configures itself, you can create your own Panamax application template based on this same principal.
Creating a Panamax Template
We'll go ahead and create a Panamax template to run PageKit, a simple CMS that runs on MySQL or SQLite, and make it accessible from the internet with Ngrok.
Creating the Application
To create the application, you simply have to search for a base Docker container to create the app from. On the home page, enter orchardup/mysql into the search bar.
Though you will see "No templates found", you will notice that there is an "Images" category. Yes, Panamax not only gives you one click access to their library of application templates, but you can actually pull in any Docker image from the public registry.
Go ahead and run the orchardup/mysql image with the "Run Image" button and let it launch. You'll see a little spinner next to the container name in the "Uncategorized" category, as well as a message in the application log indicating that the Docker image is being pulled down.
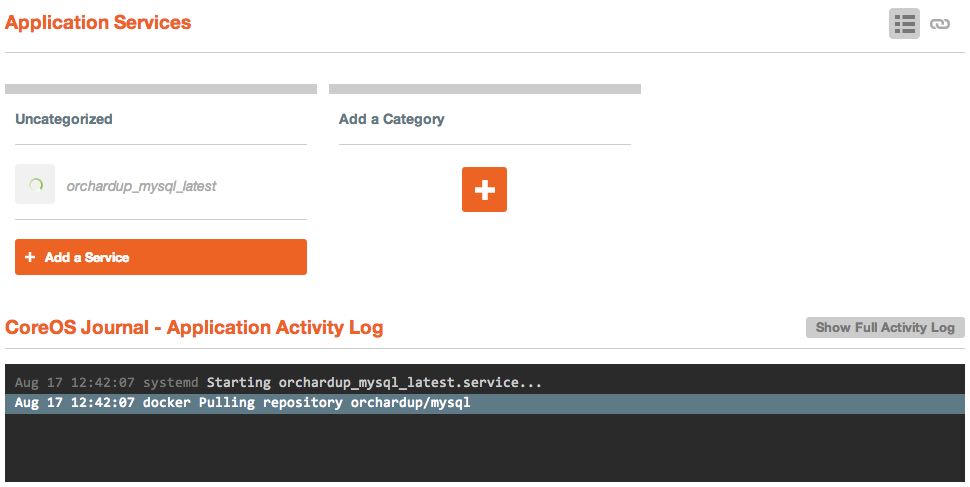
Once the image has finished pulling and launching, you should see a message indicating /usr/sbin/mysqld: ready for connections.
Though the MySQL container is running, we need to configure a couple environmental variables that will create the necessary MySQL user and database.
Under the environmental variables section, click the "Create Environmental Variable" button and enter the following variable names and values:
MYSQL_ROOT_PASSWORD: Choose a password here for your MySQL root user.MYSQL_DATABASE:pagekit
If you wish to persist the database, you can always mount a volume under the "Volumes" section. To do this, enter a path on the CoreOS host to save the data in and /var/lib/mysql as the container path. This will result in all of the data in /var/lib/mysql in the MySQL container being saved to the directory you specify on the host VM.
After you've made the appropriate changes, simply hit "Save All Changes" at the bottom of the screen to relaunch the new configuration.
Notice that we didn't expose a port for MySQL-- this is because the orchardup/mysql container specifies for port 3306, the port for MySQL, to be exposed automatically. We also are not going to specify which port to map 3306 since we will make use of the Docker links.
Launching the PageKit container
Now that we have our database up and running, we can launch the PageKit container. To do so, go back to your application's dashboard4 and add a new category titled "Web Tier" if you wish. Then, add a new service and search for the Docker image marksteve/pagekit and add it to your app.
You will see that same spinning circle next to the PageKit container as it is pulled down-- you can click on the PageKit container's name and watch the activity log to determine when it has finished initializing.
Link MySQL and PageKit
Once the PageKit container has downloaded and launched, you can add a couple of configuration variables to link the MySQL and PageKit containers together, as well as expose port 80.
To create the service link, click the "Add a Linked Service" button and select the MySQL container's name from the dropdown. In the alias text box, you must use the alias name "mysql" (without quotation marks, obviously).
To expose port 80, click "Expose a Port" and enter "80" into the text box. We don't need to actually "Bind" a port because we don't need to know which host port our container's port 80 will map to-- the automatic configuration through Ngrok will just figure it out.
Once you save the configuration, the PageKit container will relaunch and link itself to MySQL. At this point, you could figure out which port was mapped to the container's port 80 and perform the VirtualBox port forwarding steps to access the application, but we'll just go ahead and launch the Ngrok tunnel.
Creating the Ngrok tunnel
Creating the Ngrok tunnel is quite easy-- as before, you can create a new category from the application's dashboard (and name is something like "Tunnel", "Proxy Tier", etc) and add a new service. We'll use the Ngrok container I've created, which was based off the CenturyLink Ngrok container5, wizardapps/ngrok.
All you have to do to configure the Ngrok tunnel is link it to the PageKit container with the alias "APP". Once the container relaunches, find the Ngrok URL in the logs and open it in your browser.
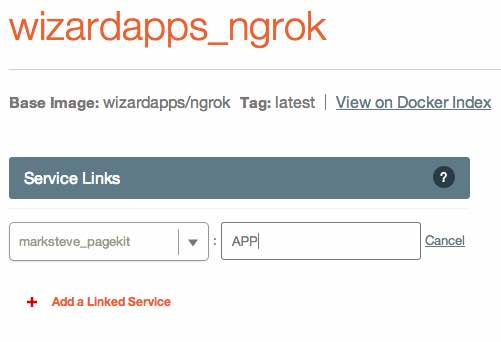
Once you open up PageKit in your web browser, you should see the installation interface. Use the following details to configure your PageKit installation:
- Driver:
MySql - Hostname:
mysql - User:
root - Password: The password you configured in the MySQL container
- Database Name:
pagekit - Table Prefix:
pk_
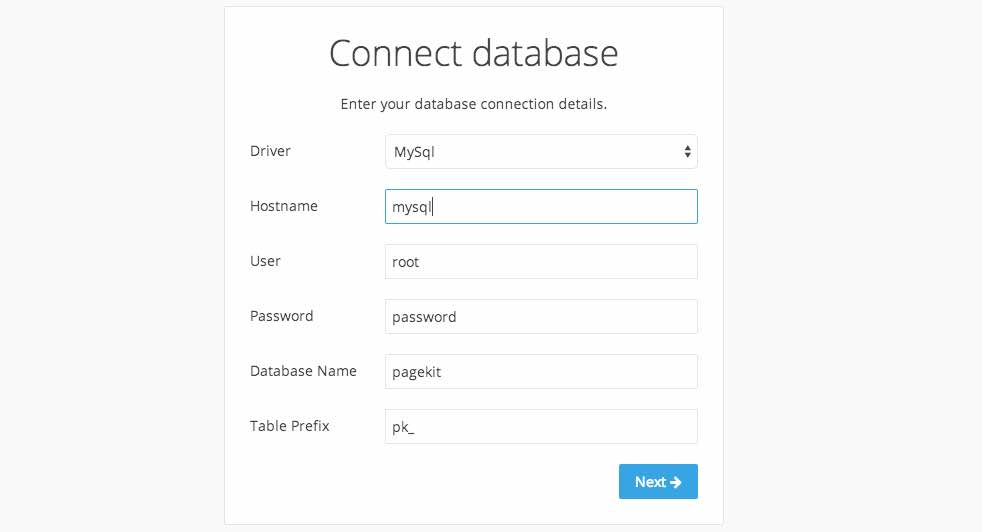
PageKit should connect to the database with these credentials. Simply finish the PageKit installation, and you're finished!
Saving the Template
Once you've created the application and played with it a bit, you can save it as an application template. Also, make sure you have a Github account (since this is where you will save the application template to).
From your application dashboard, click the "Save as Template" button. If you've never created a Panamax template before, you will need to create a Github access token and paste it into the field provided.
After you've linked your Github account, you will need to choose a repository to save the application template to. For example, you can fork the official Panamax public templates repository on Github and select your personal fork from the dropdown menu. Alternatively, you can create a new repository, though your templates will not be visible by others if you do so (unless they add your repository to their sources list).
Once you've filled out the remaining fields, you can preview the template file YAML at the bottom to see how the file is constructed, or publish your template directly to Github.
I've published the completed "Ngrok + PageKit" template on my Github repository for your reference. The only difference between the version I've published and the tutorial here is that I've manually edited some of the names of the containers for clarity.
Hopefully you've learned a thing or two about Panamax and Docker. CenturyLink has produced a fairly intuitive UI that makes Docker accessible to more people, and I'm exciting for several new features such as multi-host support. The tools popping up around Docker are exciting for the entire community, and I'm proud to be a part of it.
Ngrok Container Additional Configuration
The Ngrok container can be configured through environmental variables to support other features such as custom subdomains (or domains, if you are a paying Ngrok customer), HTTP authentication, and raw TCP protocol support.
For reference on these configuration items, you can visit the "wizardapps/ngrok" page on the Docker registry.
To use these configuration items with the PageKit template above, simply add the appropriate environmental variables to the Ngrok container. Once it is relaunched, you should be able to use the new features that you configured.
- If you don't have Homebrew for Mac, you can install it with by following the instructions on the Homebrew wiki ↩
-
Don't see the "Ngrok + Wordpress + MySQL" template? You may have to add the proper repository to Panamax. Click "Manage" at the top in the menu bar, click "Manage Sources" in the middle column, and add my Github repository:
https://github.com/andrewmunsell/panamax-contest-templates. ↩ - An important thing to notice is that all of the options on this page are simply user-friendly and web-exposed versions of the command line switches available to the Docker CLI. As I'm sure you've realized, Panamax doesn't necessarily extend Docker-- it just makes it significantly easier to manage. Also important to note-- none of the configuration categories on the page are specific to the Ngrok container. All of these same categories will be available to any container you launch. ↩
- The application dashboard is not the one with the sections such as "Environmental Variables", etc. The app dashboard has a list of all the running containers in your application, and will list the "orchardup_mysql_latest" container under "Uncategorized". ↩
- I've exposed some additional options, such custom subdomains and HTTP authentication over what was originally included in the CenturyLink Docker image ↩